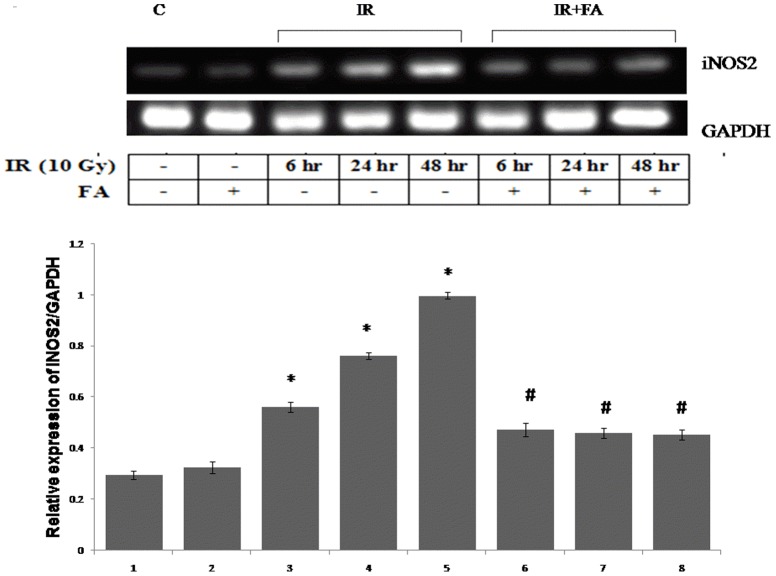
Figure 11. iNOS2 gene expression.
iNOS2 gene expression was analysed by RT PCR. Lane 1: control group of mice, lane 2, 3 and 4: mice irradiated with 10 Gy (IR), and sacrificed after 6, 24, 48 hours of post irradiation (IR6, IR24 & IR48). Lane 5: mice treated with FA and lane 6, 7, 8: mice treated with FA plus irradiated (FA+IR6, FA+IR24 & FA+IR48). Error bars were SEM for n = 3. p<0.05 was considered significant. Statistical comparison: * control vs. IR #IR vs. FA+IR.

