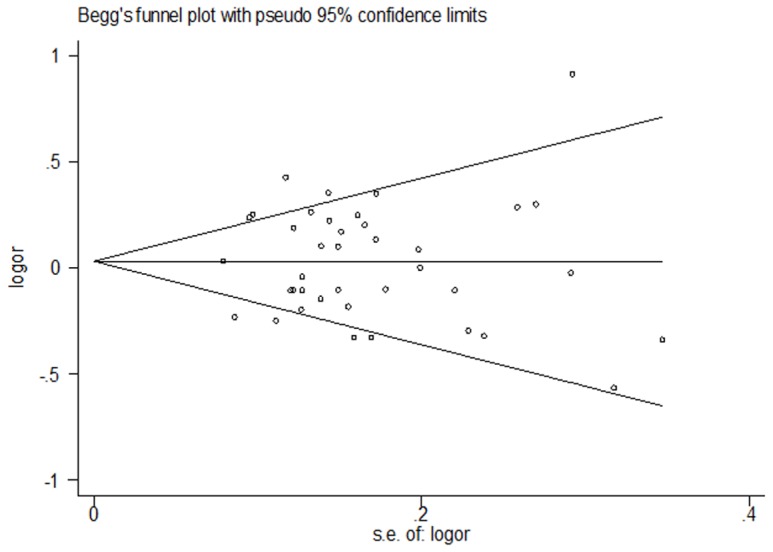
Figure 6. Begger's funnel plot of publication bias for PARP-1 Val762Ala polymorphism with cancer risk under dominant model (VA+AA vs. VV).

Each dot represents a separate study for the indicated association. Funnel plot of all 39 eligible studies P = 0.753, Egger's test P = 0.916.
