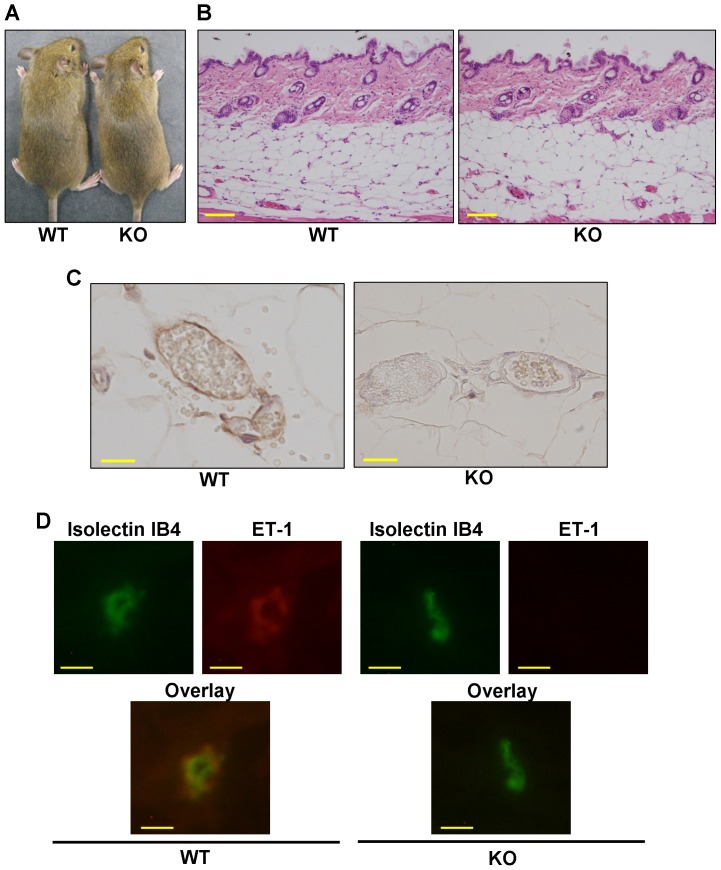
Figure 1. Comparison of the ET-1 expression between wild-type and ET-1f/f; Tie-2-Cre (+) mice skins.
(A) Gross comparison of a wild-type (WT) and an ET-1f/f; Tie-2-Cre (+) (KO) mouse at 8 weeks. (B) Representative haematoxylin and eosin (HE) staining of skin section from a wild-type (WT) and an ET-1f/f; Tie-2-Cre (+) (KO) mouse. (C) Representative ET-1 staining of subcutaneous blood vessels in a wild-type (WT) and an ET-1f/f; Tie-2-Cre (+) (KO) mouse. Scale bar = 20 µm. (D) Dermal vessels of wild-type (WT) and ET-1f/f; Tie-2-Cre (+) (KO) mice were stained with antibodies against isolectin IB4 (green) and ET-1 (red). Scale bar = 10 µm.

