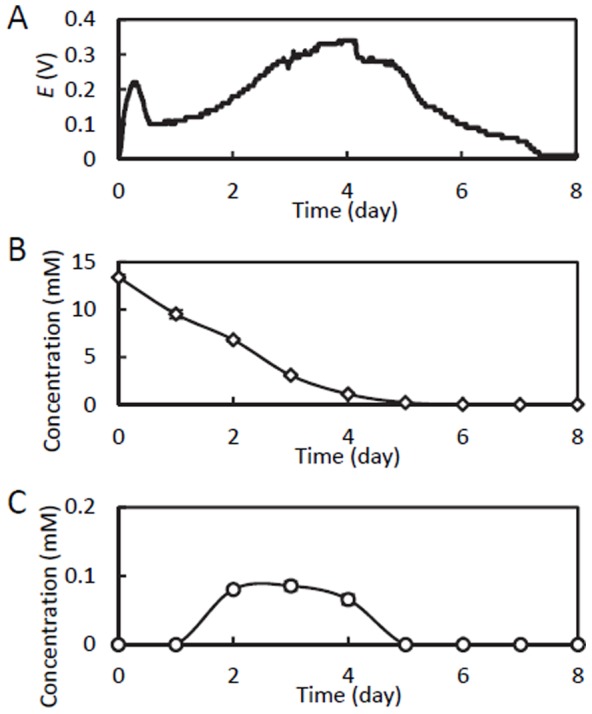
Figure 1. Typical time courses of cell voltage (A), methanol concentration (B), and acetate concentration (C), after supplementation of the MFC with 10 mM methanol.

In panels B and C, data are means ± SD (n = 3), and error bars are shown when they are larger than symbols.
