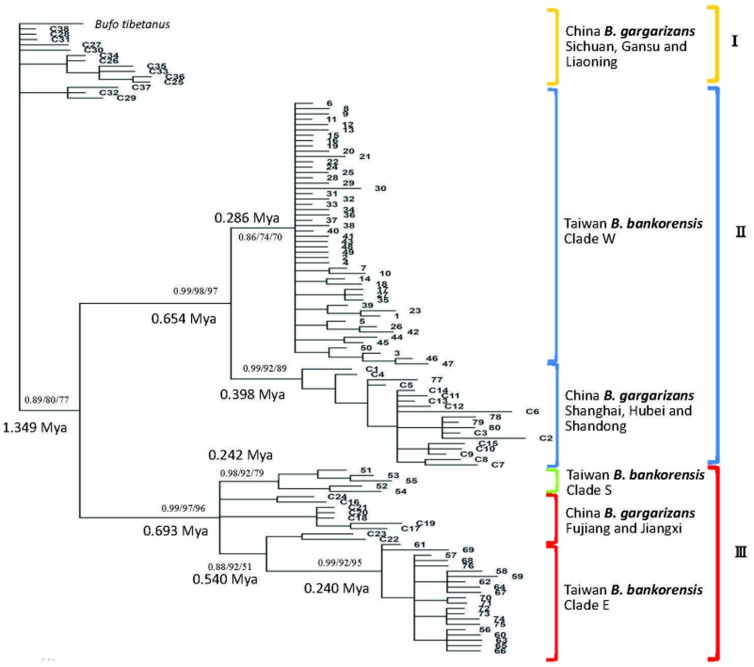
Figure 2. Phylogenetic trees reconstructed with MRBAYES from sequences of the mitochondrial D-loop gene in B. bankorensis and B. gargarizans.
The values above the branches are the posterior probabilities for the Bayesian analysis and bootstrap values for the NJ and ML analyses. Bayesian phylogeny based on D-loop sequences (348 bp, n = 119) showing the relationships among Taiwan and mainland China phylogroups. Clade W, E and S were distributed in the western, eastern and southern CMRs in Taiwan Island, respectively.

