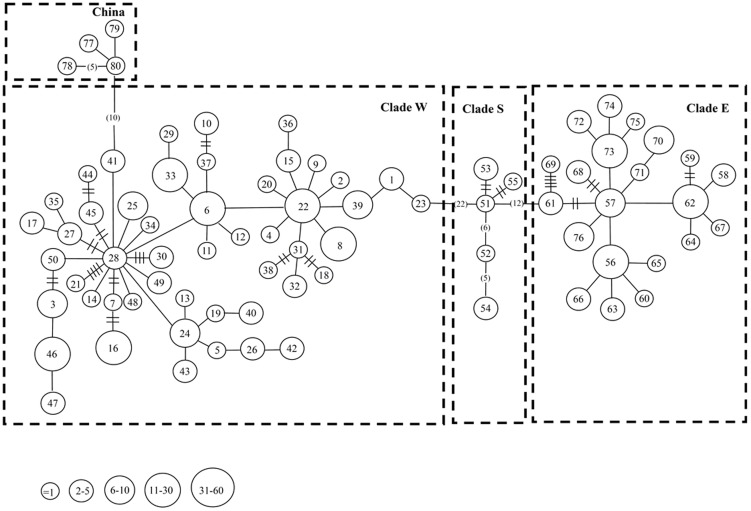
Figure 3. A minimum spanning network constructed using the 80 mitochondrial D-loop haplotypes identified in B. bankorensis and B. gargarizans.
Haplotype designations (Table 1) are indicated next to each circle. Locality designations (see Figure 1) for specimens possessing each haplotype are indicated inside the circles. The sizes of the circles are proportional to the number of individuals represented. The length of the lines between circles is roughly proportional to the estimated number of mutational steps between the haplotypes.

