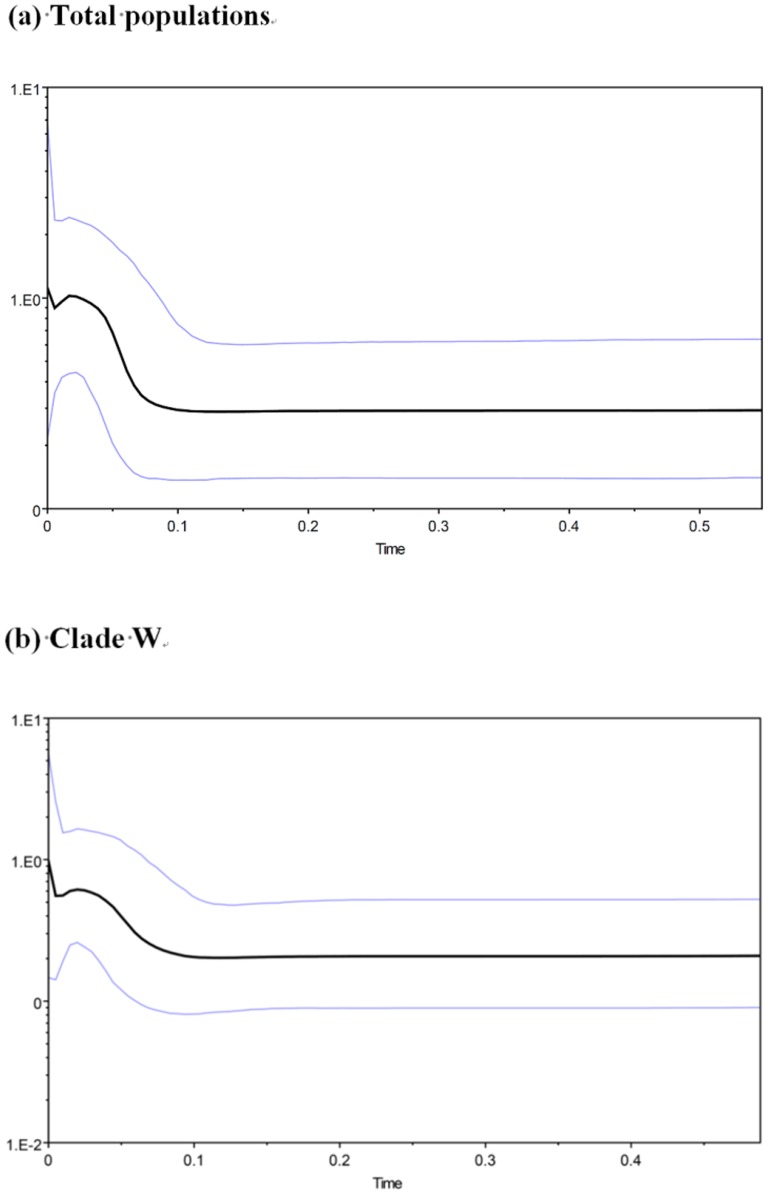
Figure 4. Bayesian skyline plot of the effective population sizes over time for B. bankorensis.
The X axis is the time before the present in units of million years ago, and the Y axis is the estimated effective population size in units of Neτ, i.e., the product of the effective population size and the generation length in years (log transformed). (a) Total populations and (b) Clade W.

