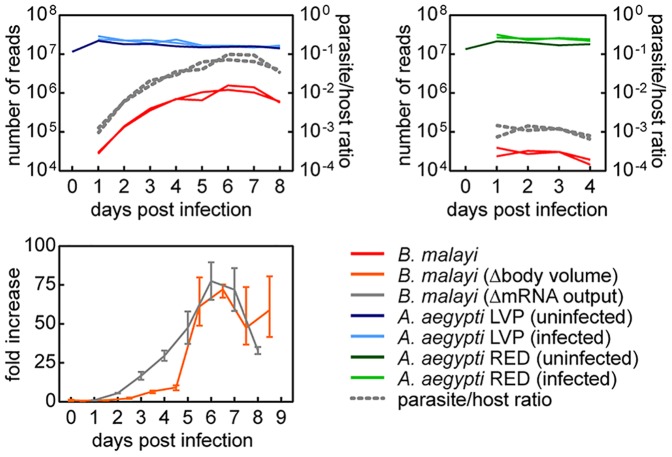
Figure 3. Total number of aligned paired-end reads.
Upper panels represent paired-end reads that aligned unambiguously to the gene models of Aedes aegypti (left panel LVP, right panel RED) and Brugia malayi. Biological replicates were plotted as separate lines. The lower panel represents the relative changes in transcriptional output and body volume during B. malayi development in Ae. aegypti LVP. Temporal change in transcriptional output was estimated from parasite/host ratio of total read counts, assuming that the host mRNA output is constant over time. Volumetric calculations were based on measurements reported by Murthy and Sen [40] after approximating the shape of the worm to a cylinder. Error bars denote range.

