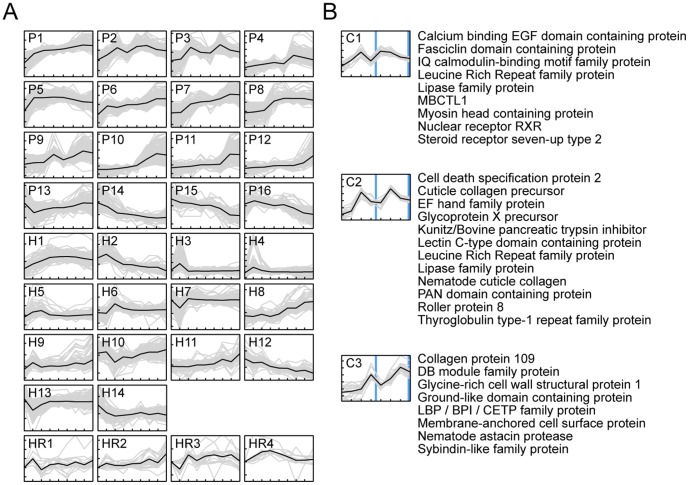
Figure 4. Time-course transcript abundance profiles.
The vertical scale displays log2 fold-change in increments of 2, and the horizontal scale displays time in days. (A) Non-flat profiles (p<0.01 and maximum fold-difference among time points >2) were grouped into common temporal patterns using k-means clustering. Black lines represent mean expression profiles; P1–16, k-means clusters of Brugia malayi during development in Aedes aegypti LVP between day 1 and 8 post infection; H1–14, k-means clusters of Ae. aegypti LVP infected with B. malayi between day 0 and 8 post infection; and HR1–4, host response profile comparing infected vs. uninfected A. aegypti LVP. (B) B. malayi transcripts displaying periodic patterns with respect to molting events (blue vertical lines) during development in Ae. aegypti LVP. For each temporal pattern with distinct kinetics the top 20 transcripts displaying the greatest magnitude of change were plotted along with their respective gene descriptions (C1–3). Uninformative annotations (e.g., hypothetical proteins) were omitted.

