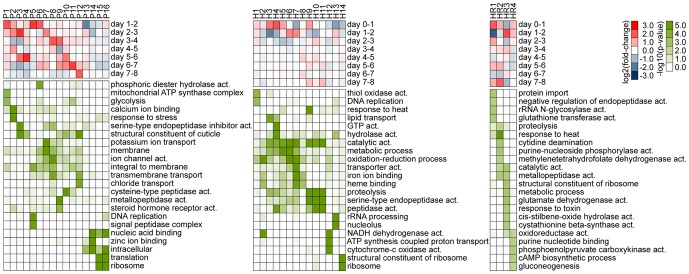
Figure 5. Temporal expression dynamics across clusters.
Mean expression changes between sequential time points (red-blue), and over-represented Gene Ontology (GO) terms (green-white) for gene clusters shown in Figure 4A. Significant GO terms were summarized into a representative subset (see Dataset S1 for a full list of terms).

