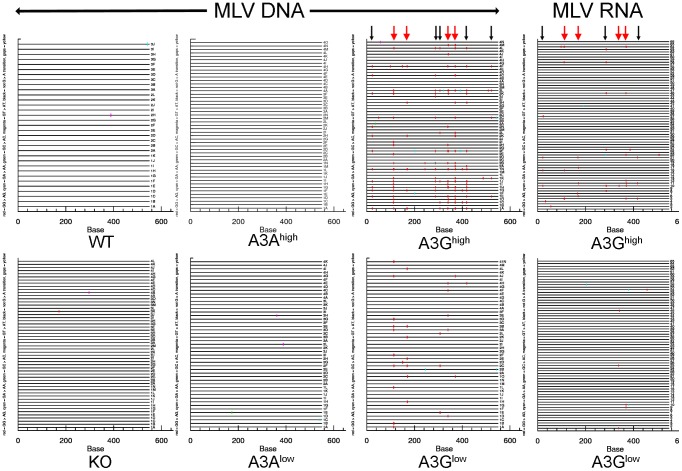
Figure 4. Deamination of M-MLV viral DNA and RNA in A3G transgenic mice.
Splenic DNA or RNA from virions was isolated from the infected mice described in Figure 3 and cloned and sequenced. In most cases > 10 sequences from 4 different mice were analyzed, as indicated in the figure. For the viral RNA samples, the viruses from 5 animals were pooled for sequencing. Shown are the G to A changes in the sequences; other mutations are indicated in Table 1. Red = GG > AG, cyan = GA > AA, green = GC > AC and magenta = GT > AT transitions. Red arrows denote mutation hotspots seen in viruses isolated from A3Ghigh and A3Glow mice; black arrows denote hotspots identified only in A3Ghigh mice.

