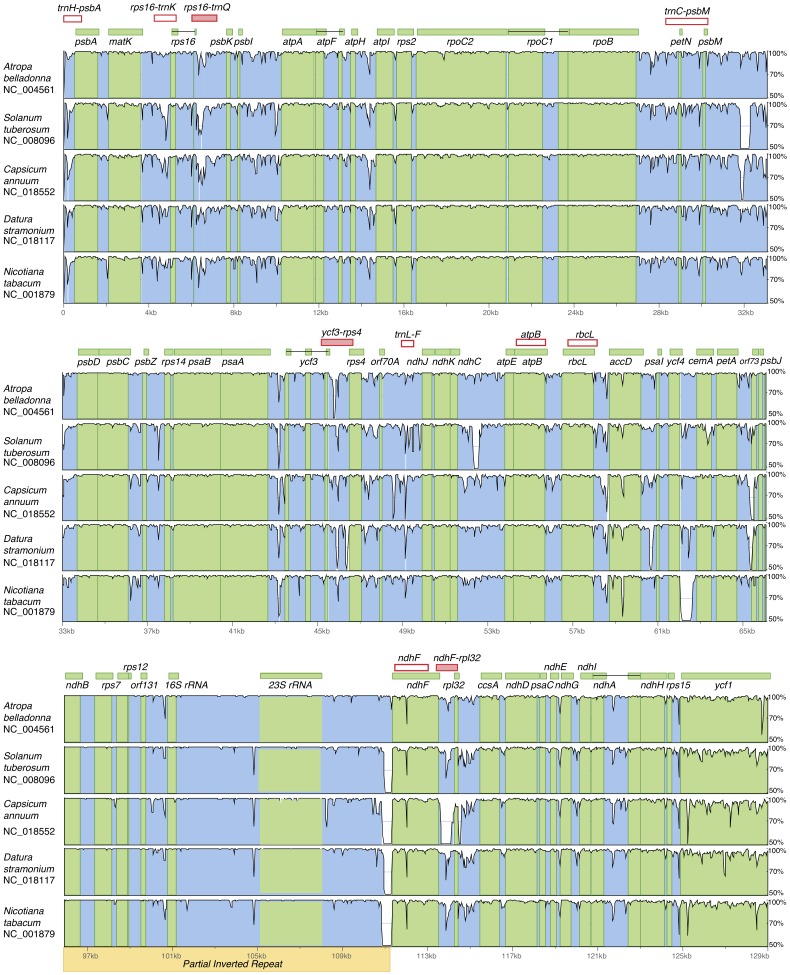
Figure 2. Identity plots comparing Hyoscyamus niger chloroplast genome to other Solanaceae.
Pairwise comparisons and sequence identity between Hyoscyamus niger and five solanaceous chloroplast genomes for selected regions using the VISTA program. The Y-axis represents the % identity (50–100%) across the chloroplast genome. Coding and non-coding regions are marked in green and blue, respectively. Pink boxes indicate known (empty boxes) and novel (filled boxes) plastid regions used in the phylogenetic analyses in this study.

