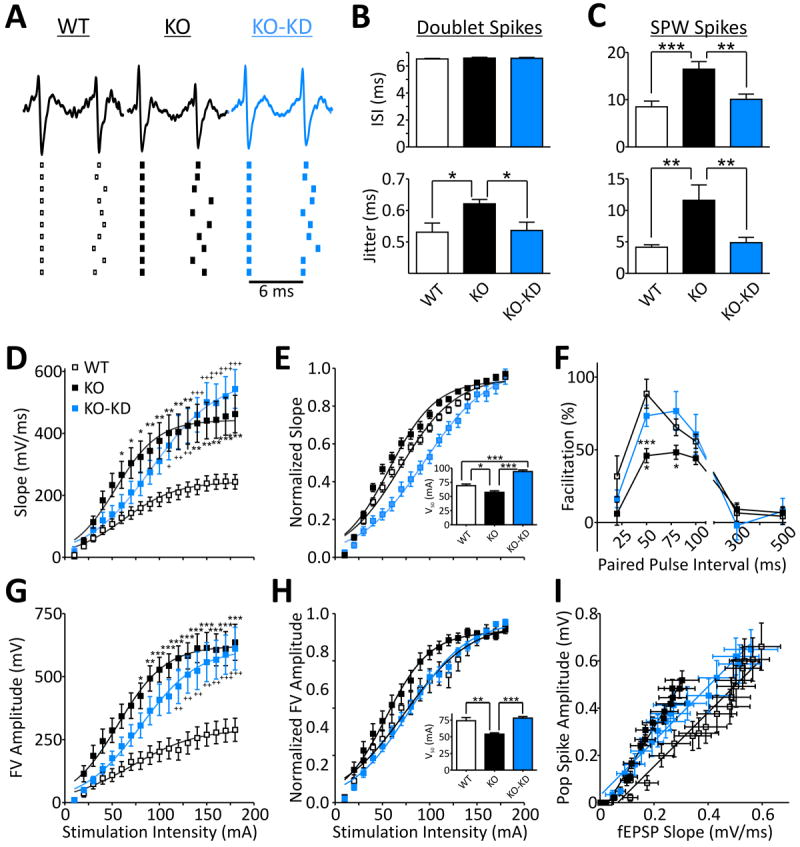
Figure 2. Ketogenic diet treatment improves spike timing and neurotransmission.

A. Example traces of doublet spikes and illustration of spike timing of ten subsequent doublets from the same neurons.
B. Quantification of doublet CA3 principal cell inter-spike intervals (ISI) and spike jitter indicating KO cells have increased jitter when similar spikes are compared between groups. [n = 20 (WT), 19 KO, 18 (KO-KD) cells]. Significance determined by an one-way ANOVA followed by Tukey’s multiple comparison test, *p<0.05.
C. ISIs and jitter of single units firing during SPWs are increased in KO and rescued with KD-treatment. [n = 20 (WT), 17 KO, 16 (KO-KD) cells]. Significance determined by an one-way ANOVA followed by Tukey’s multiple comparison test, **p<0.01, ***p<0.001.D. KD-treatment has no effect on KO field potential slopes of dendritic CA3 responses to mossy fiber stimulation. Fit with a Boltzmann equation. Significance determined with a two-way ANOVA for genotype/treatment and stimulation intensity (n = 6 slices). Genotype/treatment [F(2,270)=76.74, p<0.001) and stimulation intensity [F(17,270)=31.07, p<0.001] had significant effects and interaction [F(34,270)=1.904, p<0.01]. The two-way ANOVA was followed by Tukey’s multiple comparison test, *p<0.05, **p<0.01, ***p<0.001 (WT vs. KO); +p<0.05, ++p<0.01,+++p<0.001 (WT vs. KO-KD).
E. KD-treatment significantly increases the half maximal stimulation intensities (V50) of the normalized I/O curves of field potential slopes. Fit with a Boltzmann equation. Significance for V50’s determined with a one-way ANOVA followed by Tukey’s multiple comparison test, *p<0.05, ***p<0.001 (n = 6 slices).
F. KD restores mossy fiber-CA3 paired pulse facilitation. Significance determined by a two-way ANOVA for genotype/treatment and stimulation interval (n = 6 slices). Genotype/treatment [F(2,54)=5.823, p<0.05) and stimulation interval [F(5,54)=38.83, p<0.001] had significant effects. The two-way ANOVA was followed by Tukey’s multiple comparison test, *p<0.05 (KO vs. KO-KD), ***p<0.001 (WT vs. KO).
G. KD-treatment has no effect on KO fiber volley amplitudes of mossy fibers. Fit with a Boltzmann equation. Significance determined with a two-way ANOVA for genotype/treatment and stimulation intensity (n = 6 slices). Genotype/treatment [F(2,306)=110.6, p<0.001) and stimulation intensity [F(17,306)=27.84, p<0.001] had significant effects and interaction [F(34,306)=1.62, p<0.05]. The two-way ANOVA was followed by Tukey’s multiple comparison test: *p<0.05, **p<0.01, ***p<0.001 (WT vs. KO); ++p<0.01,+++p<0.001 (WT vs. KO-KD).
H. KD-treatment significantly increases the half maximal stimulation intensities (V50) of the normalized I/O curves of fiber volley amplitudes. Fit with a Boltzmann equation. Significance for V50’s determined with a one-way ANOVA followed by Tukey’s multiple comparison test, *p<0.05, ***p<0.001 (n = 6 slices).
I. KD-treatment has an intermediate effect on CA3 field EPSP slopes and population spike slopes compared to KO and WT. The net effect produces a shift in the extracellular field EPSP-population spike relationship to the right with a slope similar to WT indicating a decrease in the excitability of CA3 neurons (n = 6 slices).
