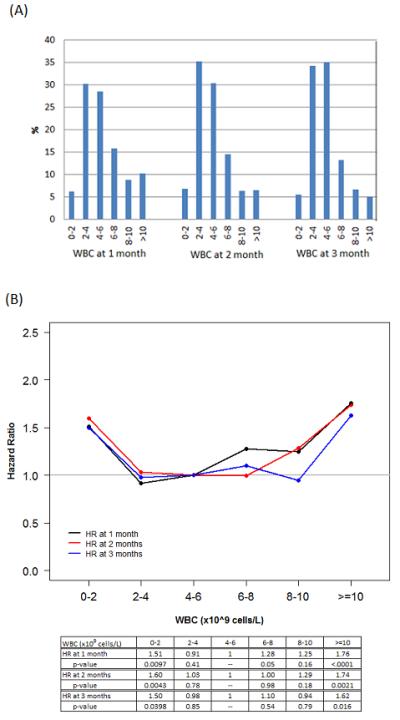
Figure 1.

(A) Distribution of WBC at 1,2,3 months after HCT. Landmark analysis was performed excluding relapse or death prior to each time point. (B) Hazard ratios of WBC at 1,2,3 months after HCT. The reference group is WBC 4.6 × 10⁹ cells/L. The gray horizontal line represents hazard ratio of 1.
