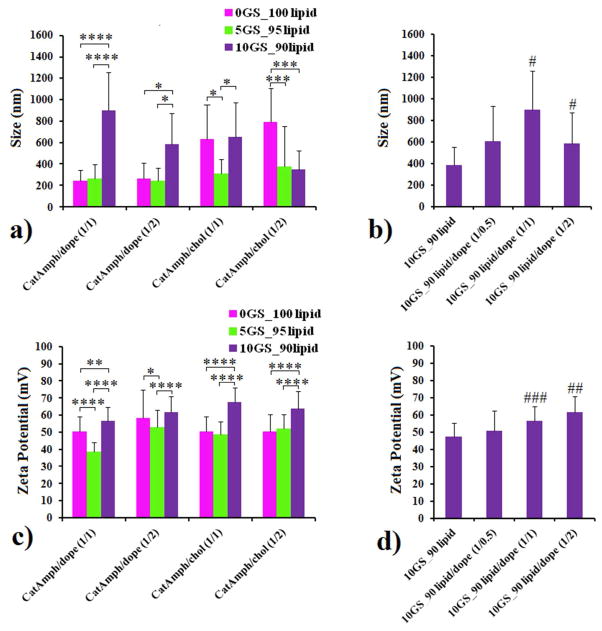
Figure 2.
The impact of GS on the size (panels a, b) and zeta potential (panels c, d) of liposomes generated from SPYRIT-7 cationic lipid and DOPE or cholesterol at 1:1 or 1:2 lipid/colipid molar ratios. Error bars represent s.d. (n = 10–12. P values were determined by two-way ANOVA within one set of formulations (*P < 0.05, **P < 0.01, ***P < 0.001 and ****P < 0.0001) or one-way ANOVA, comparing the value with the previous one in the series (#P < 0.05, ##P < 0.01, ###P < 0.001 and ####P < 0.0001). Only the statistical significant differences were shown.

