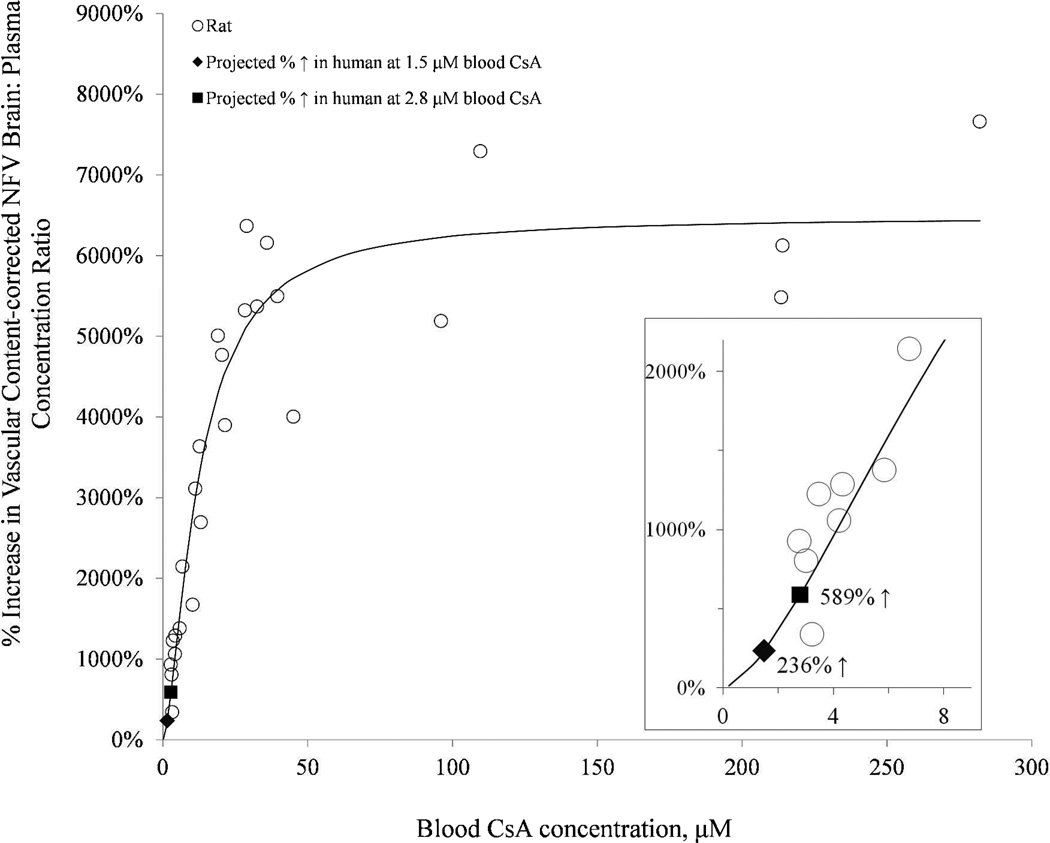
Fig 3.
With increasing CsA blood concentration, the percent increase in the brain:plasma NFV concentration ratio, expressed relative to that in the control group (absence of CsA), increased as the blood CsA concentration increased. The Hill equation was fitted to these data using nonlinear regression (uniform weighting) and yielded the following estimates (% CV of the estimate): Emax 6481% (5.9%), EC50 12.3 µM (13.5%), and γ 1.6 (16.5%). Inset magnifies the lower CsA blood concentration range. At the CsA blood concentration achieved in our prior human PET study (2.8 µM), the fitted model predicted a 589% increase in the NFV brain: plasma concentration ratio (solid square). At therapeutic CsA blood concentration (1.5 µM), the model predicted a 236% increase in the NFV brain: plasma concentration ratio (solid diamond).

