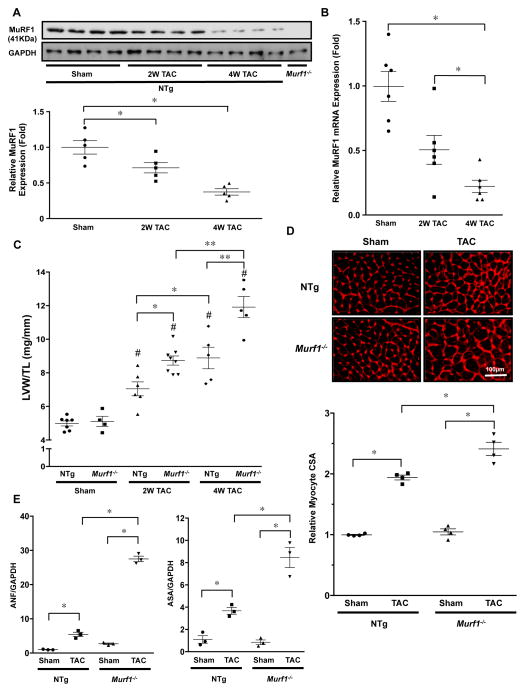
Figure 1. Gene ablation of MuRF1 enhances pressure overload-induced cardiac hypertrophy.
A, Upper: Expression of MuRF1 in mouse hearts in response to TAC. TAC (2 and 4 weeks) or sham operation was performed on NTg mice and Murf1−/− mice. Protein expression of MuRF1 and GAPDH was evaluated by immunoblotting. Lower: The results of the quantitative analysis of MuRF1 expression are shown. * P<0.05 (N=5). B, mRNA expression of the MuRF1 gene was measured by quantitative RT-PCR. * P<0.05 (N=6). C, LV weight/TL in Murf1−/− and NTg mice 2 or 4 weeks after TAC. # P<0.05 compared to sham-operated mice with the same genotype, * P<0.05 (N=4–8). D, Upper: Wheat germ agglutinin (WGA) staining of cardiac sections 2 weeks after TAC. Lower: Quantification of myocyte cross-sectional area. * P<0.05 (N=4). E, Fetal-type gene mRNA expression 2 weeks after TAC. Left: Atrial natriuretic factor (ANF) expression. Right: α-skeletal actin (ASA) expression. * P<0.05 (N=3).

