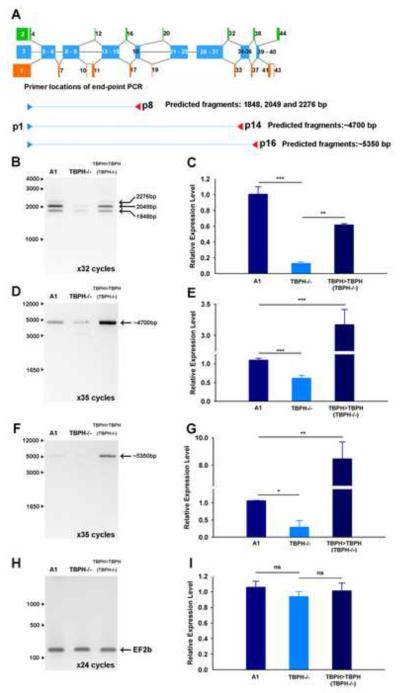
Figure 8.
Long-range RT-PCR reveals a reduction in the levels of cacophony transcripts in TBPH nulls. A. Schematic diagram showing the positions of the primers used. B–G. Semi-quantitative RT-PCR showed reduced levels of products in TBPH mutants compared to controls. The intensity of each band was measured and normalized to the intensity of the band amplified in w1118 control animals. H & I. Amplification of a control gene, EF2b, showed no change in expression between these genotypes. Mean and standard error from three independent samples are shown, ** p<0.01, *** p<0.001.

