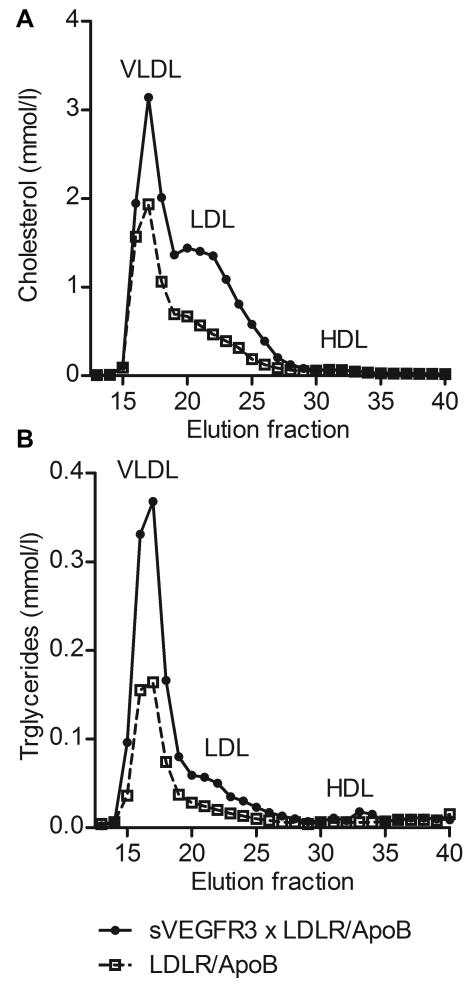
Figure 3.
Analysis of cholesterol and triglyceride levels in plasma lipoproteins. Distribution of cholesterol (A) and triglycerides (B) in different lipoprotein fractions in young sVEGFR3 × LDLR−/−/ApoB100/100 mice fed Western diet for 6 wk show clear increases in VLDL and LDL fractions in sVEGFR3 × LDLR−/−/ApoB100/100 mice compared to LDLR−/−/ApoB100/100 mice. Both genders have been used in the analysis.

