Figure 1.

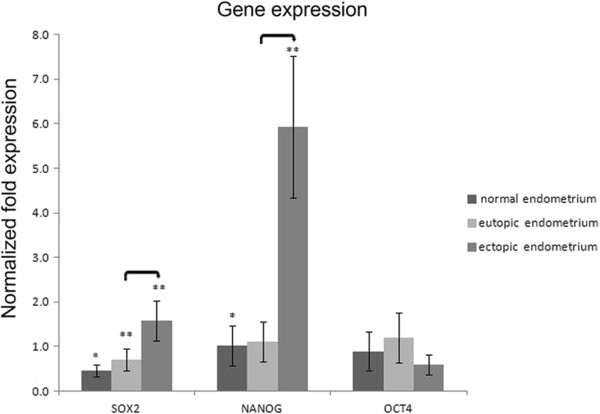
Quantitative real-time PCR analysis of SOX2, NANOG, and OCT4 mRNA. Analysis was carried out on normal endometrium (n = 10) and paired eutopic and ectopic endometrium specimens (n = 13). Double-asterisk values are significantly different from single-asterisk values. Asterisks denote significant differences between eutopic or ectopic endometrium and normal endometrium. Connecting lines denote significant differences between eutopic and ectopic endometrium. P < 0.05 was significant. Error bars denote SEM.
