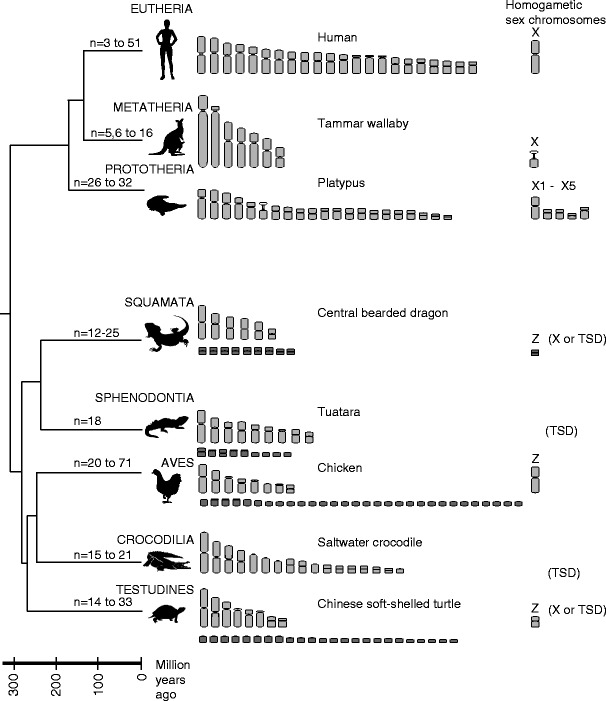
Fig. 1.

Amniote phylogeny showing haploid karyotypes for representative species. The range of haploid chromosomes numbers for each lineage are indicated on the branches (Christidis 1990; Hayman 1990; O’Brien et al. 2006; Olmo and Signorino 2005; Valenzuela and Adams 2011). Microchromosomes are indicated in dark grey. The sex chromosomes present in the homogametic sex are shown for representative species and alternatives present in each lineage are indicated. TSD temperature sex determination
