
Figure 1. Individual steering deviation data for control (n = 20) and OSA participants (n = 38) averaged over the 90-min drive.
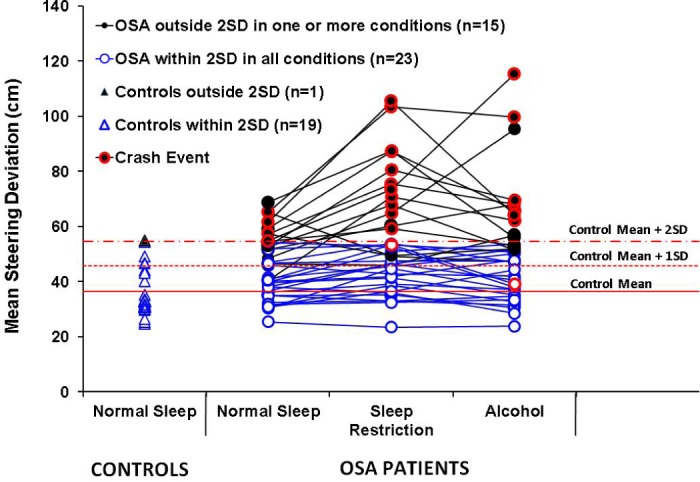
Triangles represent individual steering deviation data for control participants following normal sleep, highlighting the mean, 1 SD and 2 SD (horizontal red lines) of these control data. Circles indicate individual OSA patients showing, in blue, OSA patients with values within 2 SD under all 3 experimental conditions of the control steering data and, in black, patients outside 2 SD in one or more of the experimental conditions. OSA patients who experienced a crash event during the driving task are circled in red.