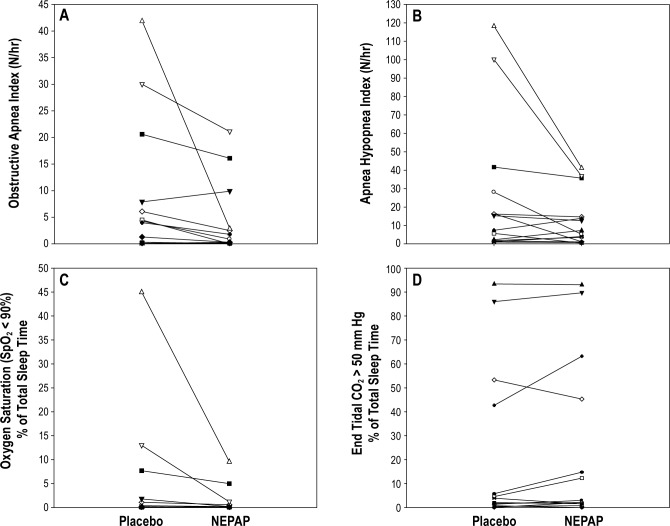
Figure 2. Changes in polysomnographic (PSG) parameters between placebo and nasal expiratory positive airway pressure (NEPAP) devices for the individual subjects (n = 14).
(A) Obstructive apnea index; (B) obstructive apnea hypopnea index; (C) percent of total sleep time with oxygen saturation (SpO2) < 90%; and (D) percent of total sleep time with end-tidal CO2 > 50 mm Hg. There was a significant decrease in the obstructive apnea index from placebo to NEPAP PSG night (p = 0.010). TST, total sleep time.

