
Fig. 2.
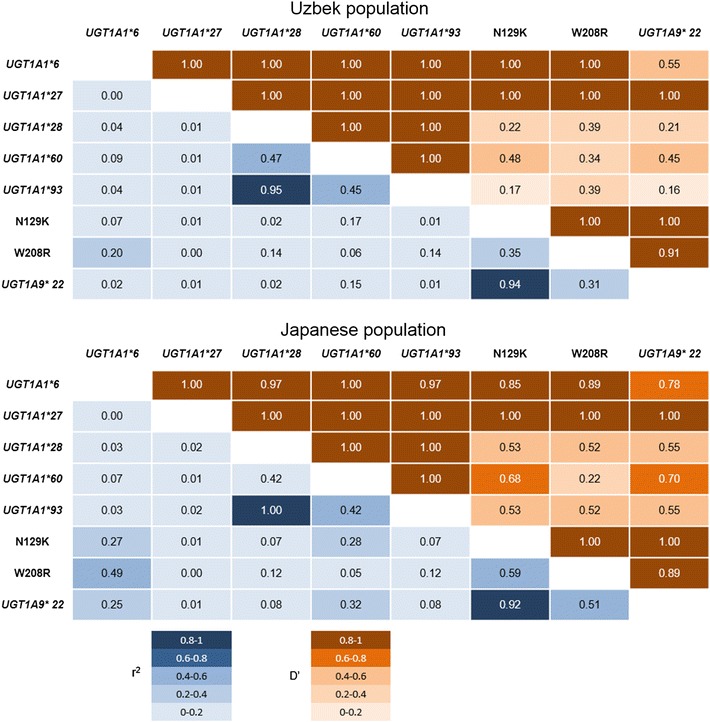
Linkage disequilibrium analysis for UGT1A1, 1A7, and 1A9 polymorphisms. Strong linkages are shown between UGT1A1*28 and UGT1A1*93, and between N129K and UGT1A1*93, respectively, in both Uzbek and Japanese populations. Each square is colored according to the value of D′ (upper brown) and r 2 (lower blue)