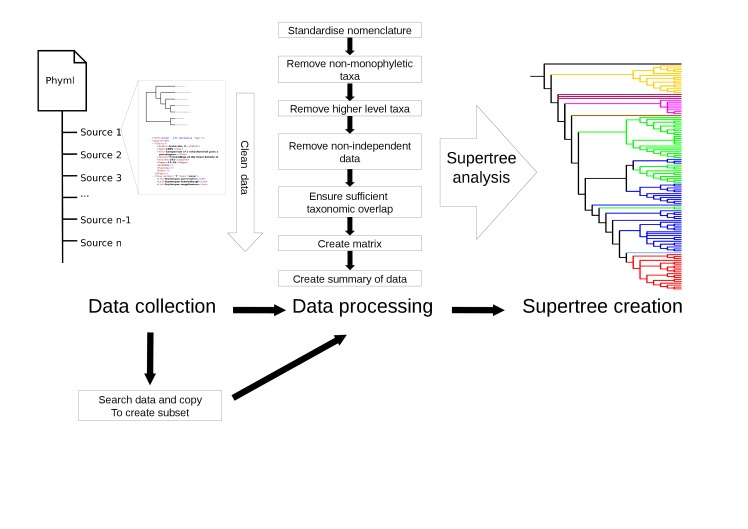
Figure 3.
Example of a processing pipeline that can be created with the STK. Data are collected and then are put through the processing pipeline in order to create a matrix. The resulting matrix (in either Nexus format (.nex) or Hennig format (.tnt)) can then be analysed in any suitable software such as PAUP* (Swofford 2003) or TNT (Goloboff et al. 2008).

