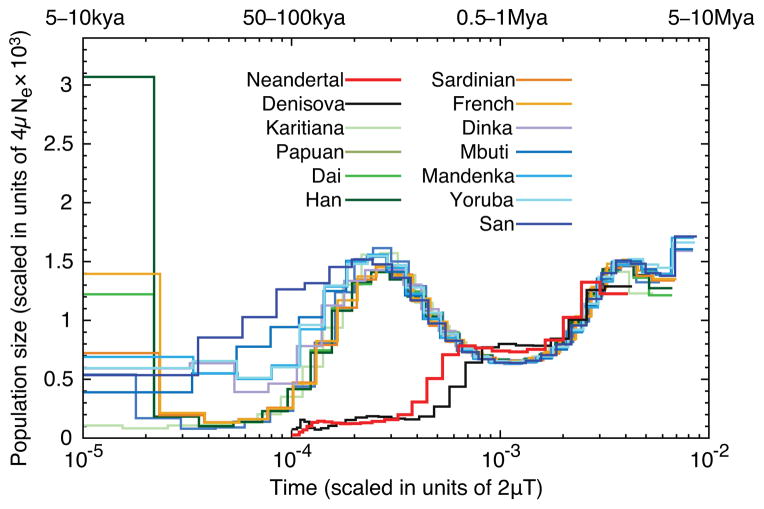
Figure 4. Inference of population size change over time.
The y-axis specifies a number proportional to the population size Ne. The x-axis specifies time in units of divergence per base pair (along the top in years for mutation rates of 0.5 × 10⁻⁹ to 1.0 × 10⁻⁹ per site per year). The analysis assumes that the Neandertal and Denisova remains are of the same age, whereas archaeological evidence and the branch shortening suggest that the Neandertal bone is older than the Denisovan bone. However, because the exact difference in ages is not known, it is not possible to determine whether the reduction in population size experienced by both archaic groups (but not by modern humans) coincided in time.

