
Figure 1. H3K4me1 is associated with features of gene repression and facultative heterochromatin.
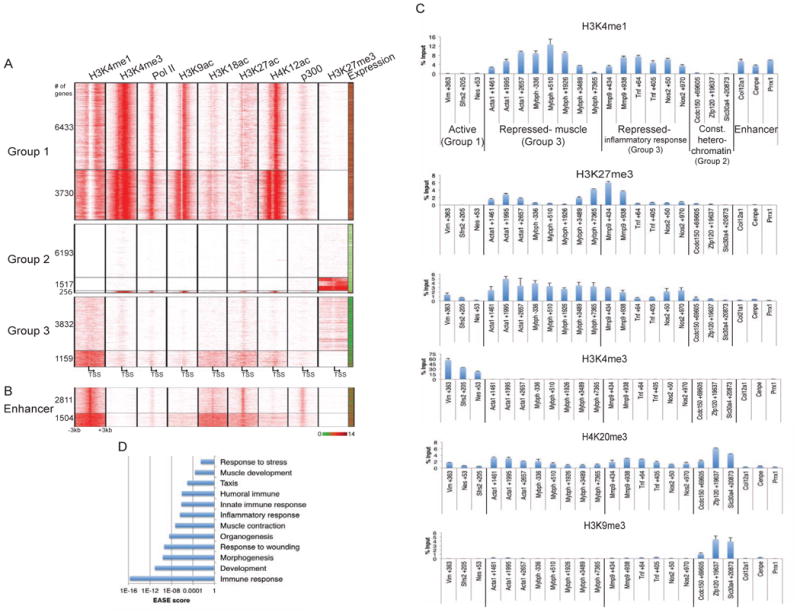
(a) Genes enriched for H3K4me1 but depleted of H3K4me3 are repressed. All genes were sorted into categories based on enrichment of H3K4me1 and H3K4me3 (Group 1: H3K4me1+/H3K4me3+; Group 2: H3K4me1-; Group 3: H3K4me1+/H3K4me3-). ChIP-seq data were plotted on regions 3 kb upstream and downstream of the TSS and (b) with respect to the midpoint of C2C12 myoblast-specific enhancers identified in Blum et al., 2012. Expression (from Liu el al., 2010) of associated genes is displayed in the far right column. Red-green key indicates relative expression. Numbers of genes in each cluster are displayed on the left. (c) A chromatin signature consisting of H3K4me1, H3K27me3, and H4K20me1 marks the promoters of muscle and inflammatory response (Group 3) genes. qChIP enrichment (presented as percent input) with the indicated antibodies in C2C12 myoblasts for Group 1, 2, and 3 genes and enhancers. Bars indicate SD. (d) H3K4me1 marks inducible genes. GO analysis of genes in Group 3 was performed, and statistically significant enrichments corresponding to EASE scores are plotted on the x-axis (logarithmic scale).