
Figure 6. Profiles of H3K4me1, H3K4me3 and Sin3A in H1-hESC.
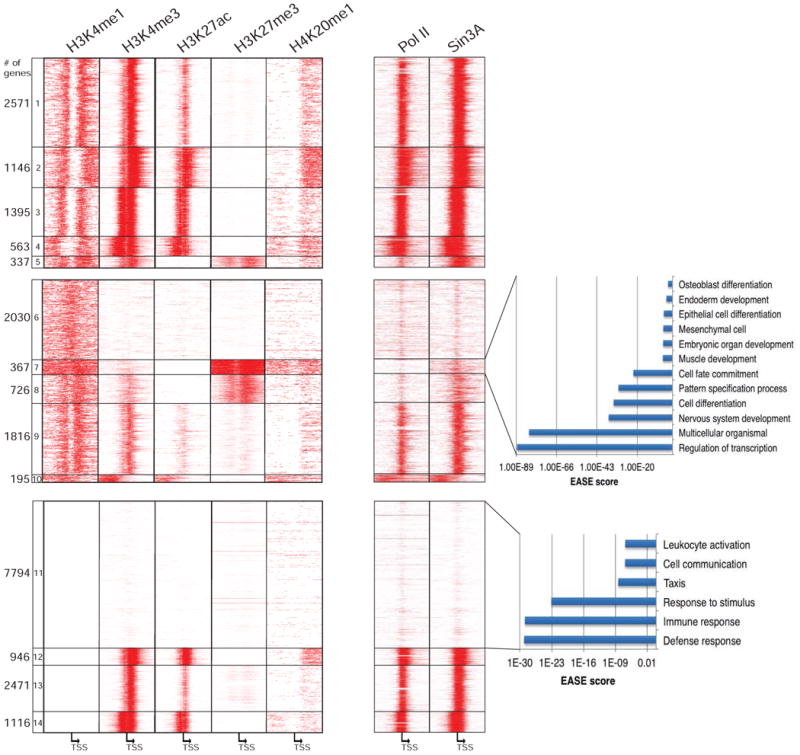
(a) ChIP-seq data for H3K4me1, H3K4me3, H3K27ac, H3K27me3, H4K20me1, Pol II, and Sin3A were obtained from the ENCODE Project Consortium (see Supplemental Experimental Procedures). Genes were sorted as in Figure 1A. (b, c) GO analysis of genes with (b) H3K4me1, H3K27me3, and H4K20me1 and (c) H3K4me1-/H3K4me3- signatures using EASE. The analysis was conducted as in Figure 1C.