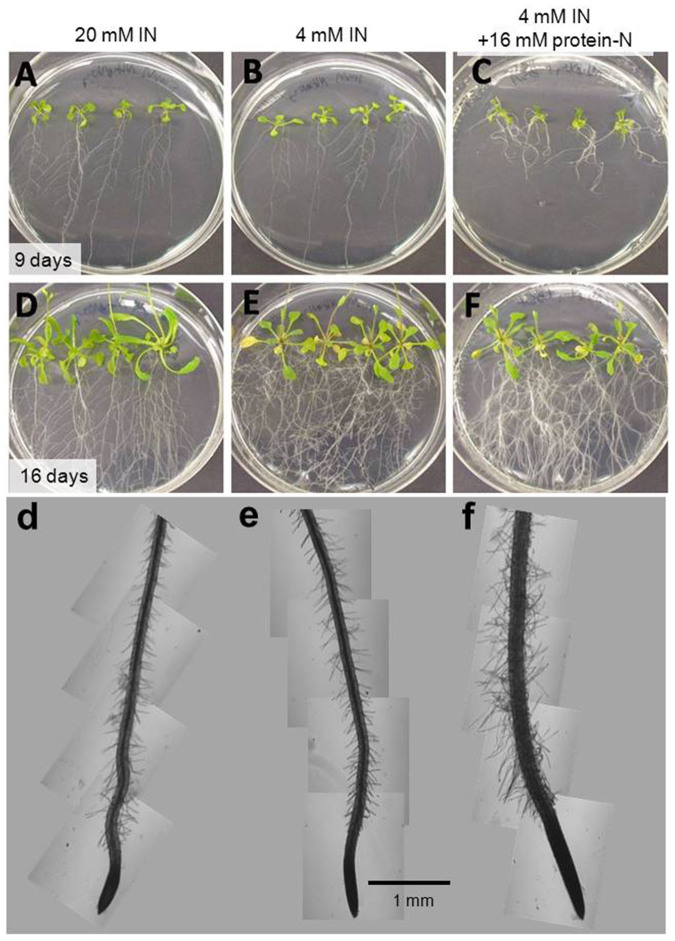
Figure 4. Growth of axenic Arabidopsis plants with replete (20 mM) or low (4 mM) IN-N concentrations or with low IN+protein (20 mM total N).
Upper row shows plants after 9 days (A–C), middle row after 16 days of growth (D–F), bottom row shows primary roots and root hairs for each treatment (d–f). For details see Table 1, experiment 2).

