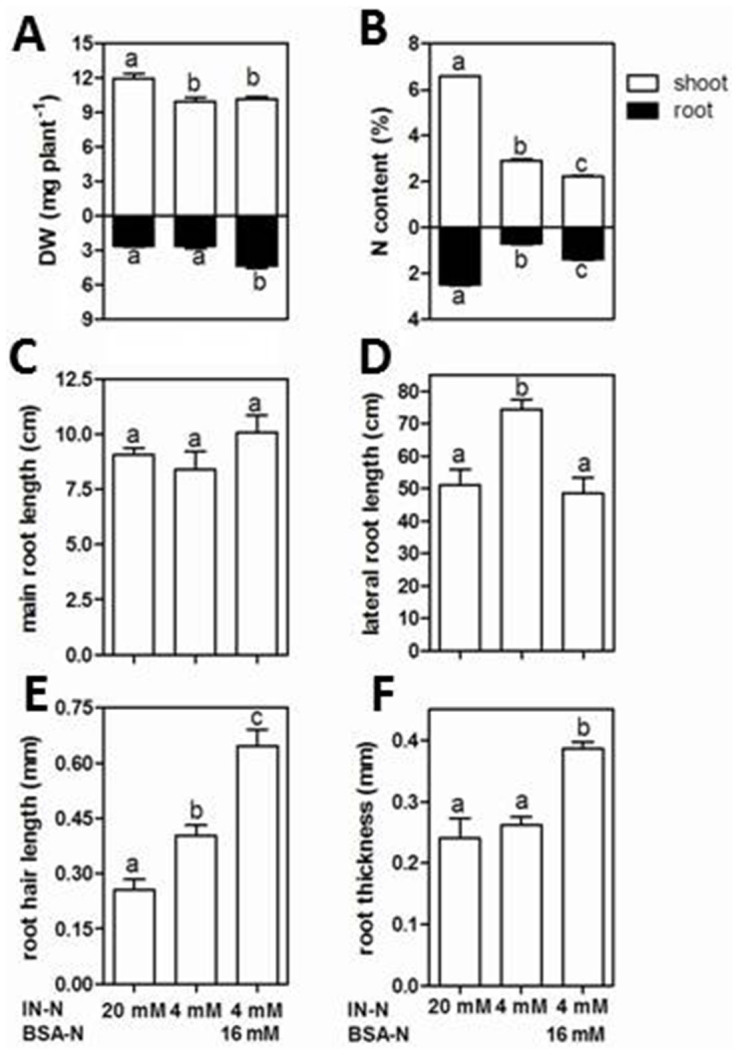
Figure 5. Dry weight (A), N content (B) and root growth (C–F) of 21-day old Arabidopsis plants grown with adequate IN (20 mM N), low IN (4 mM N), or low IN + BSA (4 mM N +16 mM protein-N).

Bars of (A–B) represent average ± SEM of 5 plates each with 4 Arabidopsis plants. Bars represent average ± SEM of 10 roots hairs on 3 plants (E) or 3–10 plants (C,D,F). Different letters in each panel indicate significant differences at P < 0.05 (ANOVA, Neuman–Keuls post hoc test).
