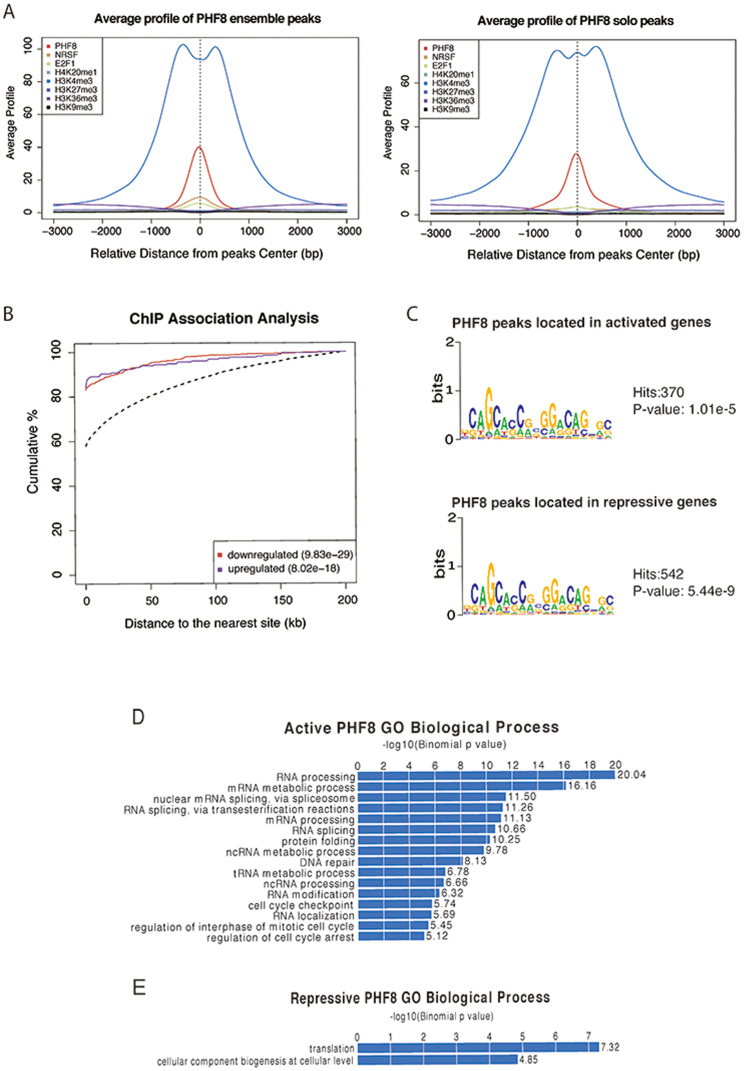
Figure 2. PHF8 activates and represses gene expression.
(A) Average binding signal profile around PHF8 ensemble and solo peaks center. PHF8, REST, E2F1, H4K20me1, H3K4me3, H3K27me3, H3K36me3, and H3K9me3 average binding signal profiles for PHF8 ensemble and solo peaks. (B) Cumulative distribution of PHF8 binding sites within certain distances of transcription start sites. ChIP association analysis of PHF8 binding at transcription start sites. Red line depicts up-regulated genes after PHF8 knockdown; blue line depicts down-regulated genes; and dashed line depicts all genes. (C) Motif analysis in PHF8-activated or -repressed genes. Motif finding was performed in peaks surrounding the top 1000 PHF8-activated and -repressed targets. (D) Processes associated with activated PHF8. GREAT analysis identified biological processes associated with activated PHF8 peaks. (E) Processes associated with repressed PHF8. GREAT analysis identified biological processes associated with repressed PHF8 peaks.

