
FIGURE 3.
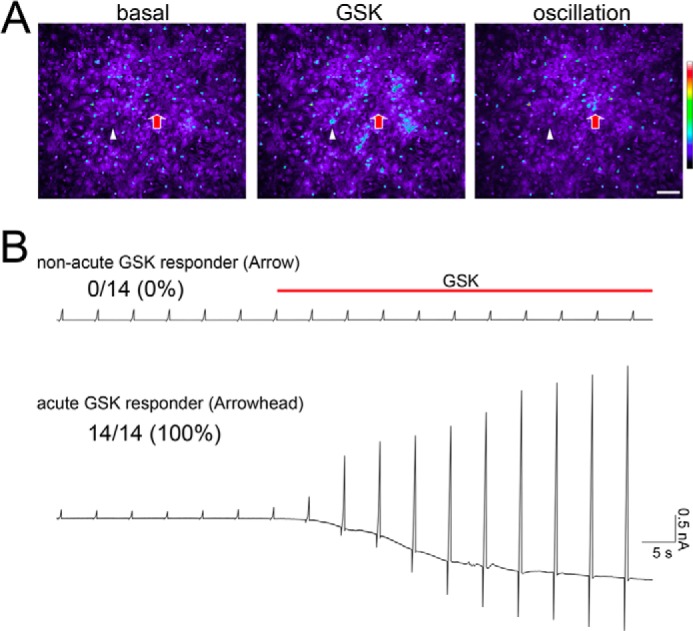
Only TRPV4+ astrocytes display an acute increase in [Ca2+]i in response to a chemical TRPV4 agonist. A, representative pictures from Ca2+ imaging experiments (see supplemental Movie 2). The initial time point (basal), the moment just after the application of 1 μm GSK (GSK), and the late Ca2+ oscillations (oscillation) are shown in representative pictures (see supplemental movie 2). White arrowhead indicates a cell that responds acutely to GSK, and the red arrow indicates a cell with a non-acute response to GSK. B, representative whole cell currents (at −60 mV holding potential) after application of 3 μm GSK in acute GSK responder cells (white arrowhead in panel A) or the non-acute GSK responder cells (red arrow in panel A). During whole-cell patch clamp recordings, we applied ramp pulses from −100 mV to +100 mV at 5-s intervals. The ratios indicate the number of astrocytes that displayed GSK-evoked currents per the total number of sampled cells, with the percentages in parentheses.