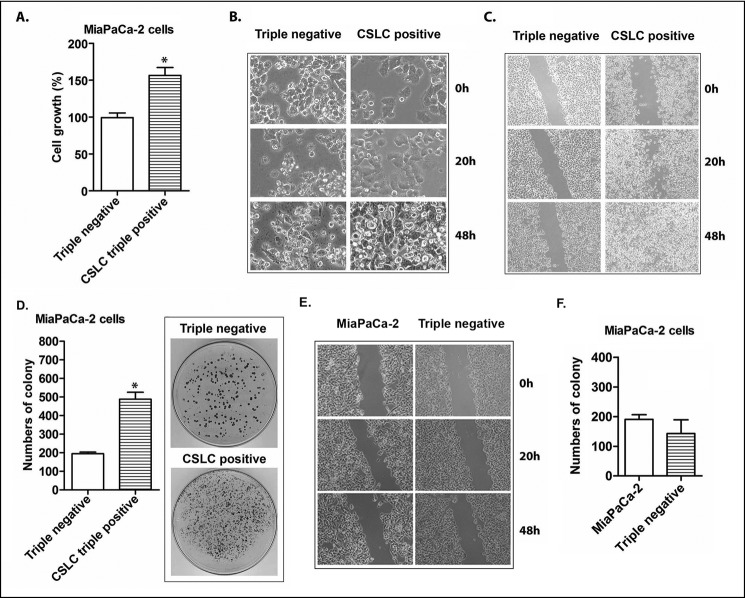
FIGURE 2.
The cell growth, migration, and clonogenicity of CSLCs (triple-marker-positive cells) compared with triple-marker-negative cells. A, the cell growth was evaluated by an MTT assay. B, morphology of CSLCs (triple-marker-positive cells) derived from MiaPaCa-2 cells compared with triple-marker-negative cells was assessed at 0, 20, and 48 h of incubation and photographed using a converted microscope (×20 magnification). C, cell migration capacity of CSLCs (triple-marker-positive cells) compared with triple-marker-negative cells was evaluated by a wound healing assay (×10 magnification). D, clonogenic potentials of CSLCs (triple-marker-positive cells) compared with triple-marker-negative cells as assessed by a colony formation assay. E, cell migration of triple-marker-negative cells (CD44−/CD133−/EpCAM−) and their parental MiaPaCa-2 cells. F, clonogenicity of triple-marker-negative cells (CD44−/CD133−/EpCAM−) and their parental MiaPaCa-2 cells. Error bars, S.D. *, p ≤ 0.05 (n = 3).

