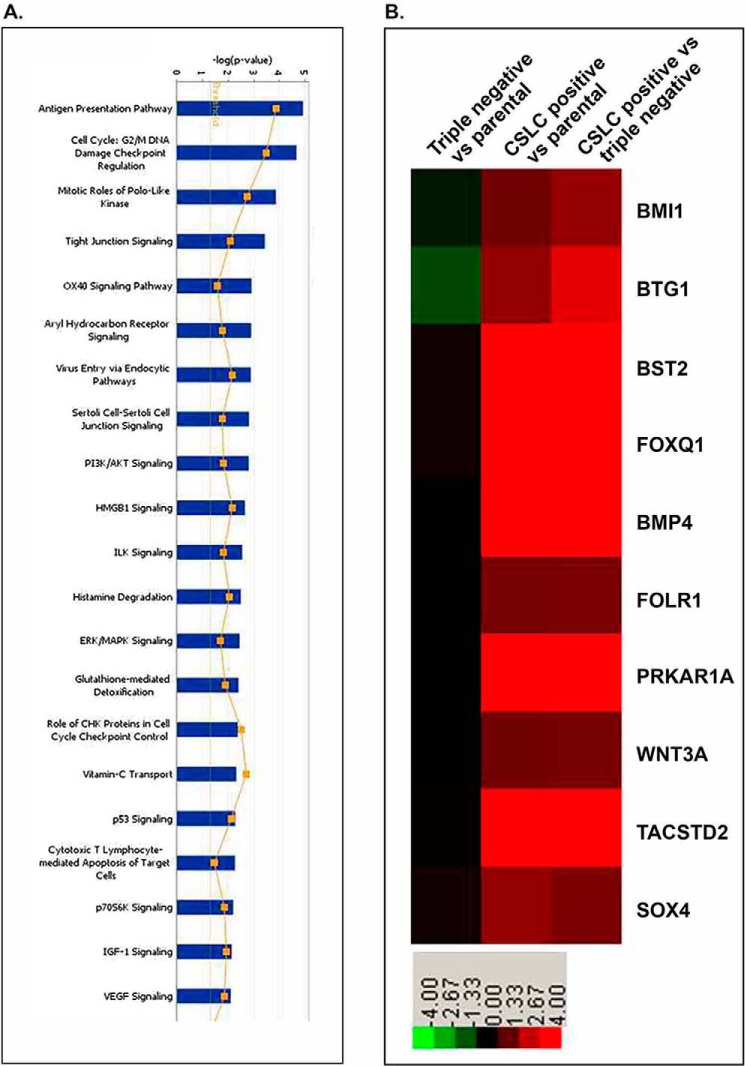
FIGURE 4.
A, pathway enrichment analysis of the altered expression of genes in CSLCs (triple-marker-positive cells) of MiaPaCa-2 cells compared with triple-marker-negative cells. B, heat map of selective CSLCs and tumor-associated genes in the triple-marker-positive cells. Microarray of mRNAs was performed by using Agilent 4 × 44k human array chips at least in triplicates. Green, negative -fold changes; red, positive -fold changes, compared with parental MiaPaCa-2 and triple-marker-negative cells.

