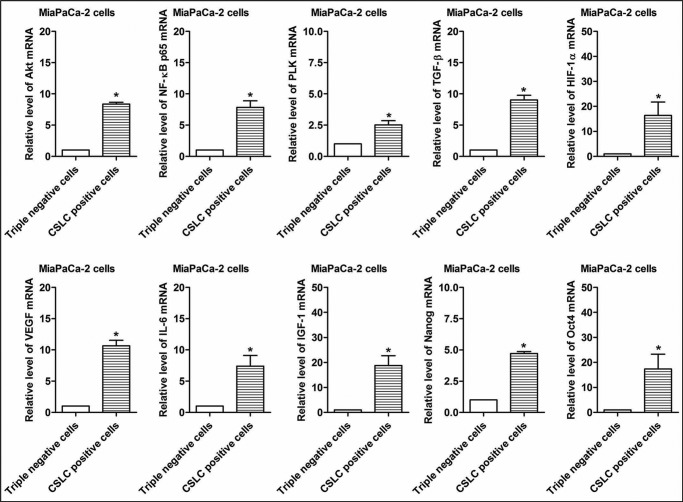
FIGURE 6.
The expression of selected genes associated with oncogenic signaling pathways in CSLCs (triple-marker-positive cells). A real-time RT-PCR assay was performed to measure the relative mRNA levels in CSLCs and tumor-associated markers. GAPDH mRNA was used as the control. Error bars, S.D. *, p ≤ 0.05 (n = 3).

