FIGURE 2.
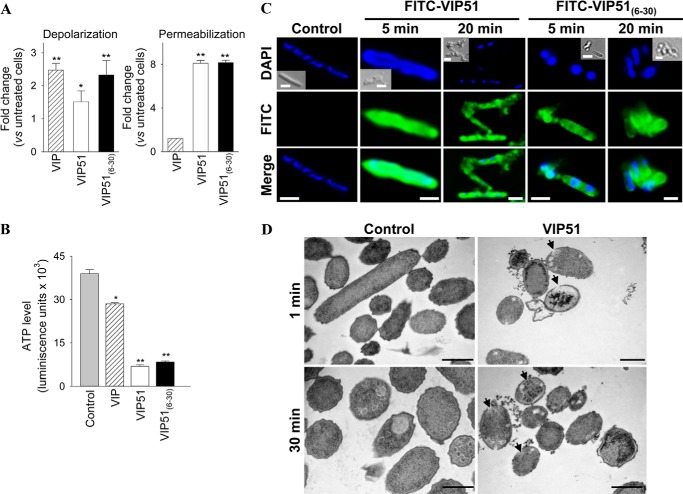
The VIP derivatives bind to the bacterial surface and disrupt the membrane integrity. A, the potential (left) and integrity (right) of plasma membrane of E. coli Top 10 cultured with PBS (control), VIP, or the VIP derivatives (each at 10 μm for 1 h) were determined by changes in bisoxonol and SYTOX Green fluorescence, respectively. Results are expressed as -fold change in depolarization or permeabilization, (F/Fm)/(Fo/Fm), where F is the fluorescence of peptide-treated bacteria, Fo is the fluorescence of untreated bacteria, and Fm is the maximal fluorescence achieved by heated E. coli. B, levels of bacterial ATP (expressed as luminescence units) in E. coli Top 10 treated with PBS (control), VIP, or the VIP derivatives (each at 10 μm for 1 h). C, binding of FITC-labeled VIP derivatives to E. coli Top 10. Bacteria were DAPI-counterstained (blue corresponds to nucleic acids). Insets, Normarski images. Scale bar, 2 μm. D, ultrastructural analysis of E. coli incubated with PBS (controls) or with VIP51 (5 μm) for the indicated times. Arrows point to intracytoplasmic vacuoles and sites of membrane damage. Scale bar, 0.5 μm. Images are representative of three independent experiments in which more than 95% of the cells displayed this pattern. In A and B, the mean ± S.E. (error bars) (n = 4, each performed in duplicate) is shown. *, p < 0.05; **p < 0.001 versus untreated bacteria (control).

