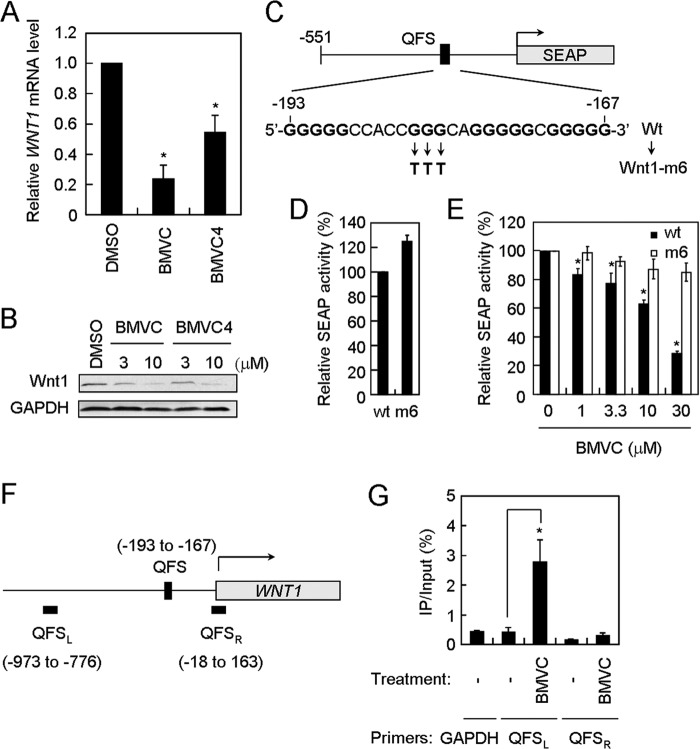
FIGURE 3.
BMVC- and BMVC4-repressed WNT1 expression through stabilizing the G-quadruplex structure formed at its promoter. A, suppression of WNT1 expression by BMVC or BMVC4 at the transcription level. The H1299 cells was incubated with 3 μm BMVC or BMVC4 for 4 days and then subjected to quantitative RT-PCR analysis. The GAPDH expression level was used as an internal control. The mRNA level of WNT1 expression in untreated H1299 cells was defined as 1. Results were obtained from the average of three independent experiments. Asterisks indicate p < 0.05 (p = 4 × 10⁻⁴ and 3 × 10⁻² for BMVC and BMVC4, respectively). B, BMVC and BMVC4 reduced the protein level of Wnt1. H1299 cells were incubated with 3 or 10 μm BMVC or BMVC4 for 4 days. Total cell extracts were prepared, and immunoblotting analysis was conducted using antibodies against Wnt1 or GAPDH. C, schematic diagrams showed the mutation sites of WNT1 in reporter assays. The G-quadruplex-forming sequences of WNT1 or WNT1-m6 (Wnt1 mutation) were indicated. D, WNT1-m6 mutation did not affect the basal expression level of WNT1. The wild-type and WNT1-m6 reporter plasmids were transfected into H1299 cells and analyzed for their basal expression activity. The relative phosphatase activity of wild-type and WNT1-m6 mutant was presented using the wild-type level as 100%. E, G-quadruplex structure formation was required for suppression of WNT1 expression by BMVC. The WNT1 reporter plasmids were transfected into H1299 cells and then incubated with the indicated concentrations of BMVC for 2 days. The phosphatase activities were then analyzed using the activity of DMSO-treated cells as 100% (right panel). Asterisks indicate p < 0.05 (p = 0.021, 0.046, 0.025, and 0.0026 for BMVC at 1, 3.3, 10, and 30 μm, respectively). F, schematic diagram showed the G-QFS and the PCR sites in chromatin immunoprecipitation assays. The analyzed PCR products and position located both 5′ (QFSL) and 3′ (QFSR) to the QFS are indicated. G, nucleolin binding to WNT1 promoter in BMVC-treated cells. H1299 cells were treated with 10 μm BMVC, cross-linked by 1% formaldehyde, sonicated, and immunoprecipitated by the anti-nucleolin antibody. The immunoprecipitates were then heated at 65 °C for 4 h to remove cross-links and treated with proteinase K, and quantitative real-time PCR analyses using primers targeting GAPDH, QFSL, and QFSR were conducted. The resulting immunoprecipitation values were quantified, divided by the Input controls, and presented as % of immunoprecipitate/input. The average values of three independent experiments are plotted. The asterisk indicates p < 0.05 (p = 0.024).

