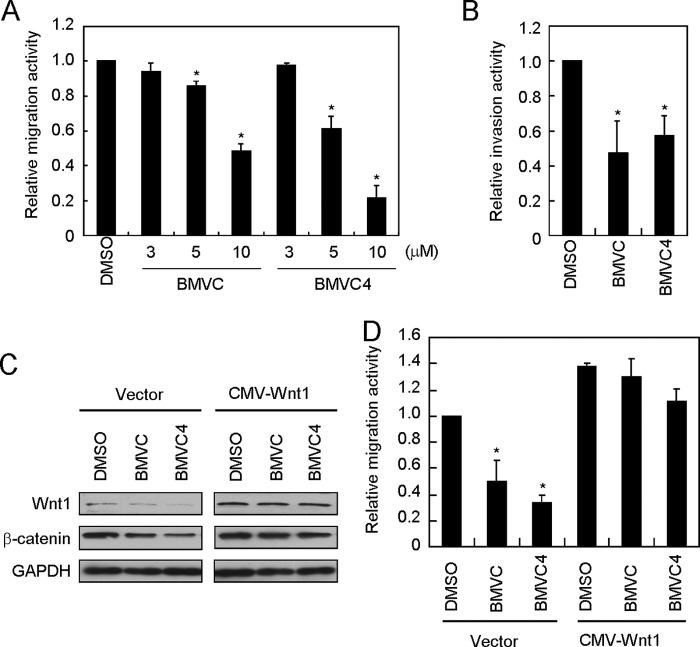
FIGURE 5.
BMVC and BMVC4 reduce the migration and invasion activities of H1299 cells. A, the migration ability of H1299 cells was suppressed by BMVC and BMVC4. H1299 cells were incubated with 10 μm DMSO or 3, 5, or 10 μm BMVC or BMVC4 for 4 days, and then the treated cells were subjected for scratch assays. Relative migration rates of H1299 cells were determined by migration distance over the time. The value of migration rate in DMSO-treated cells was defined as 1. Asterisks indicate p < 0.05 (p = 0.006 and 0.003 for BMVC at 5 and 10 μm; p = 0.020 and 0.002 for BMVC4 at 5 and 10 μm, respectively). B, reduction of invasion activity by BMVC or BMVC4. H1299 cells were incubated with 10 μm BMVC or BMVC4 for 4 days then analyzed by invasion assays. The cells were stained with crystal violet, dissolved in acetic acid, and quantified for absorption at A560 using a spectrophotometer. The results were expressed as relative values using DMSO-treated cells as 1. Asterisks indicate p < 0.05 (p = 1 × 10⁻² and 1 × 10⁻² for BMVC and BMVC4, respectively). C, immunoblotting analysis of Wnt1 and β-catenin in WNT1-overexpressing cells. H1299 cells were transfected with plasmid carrying CMV promoter-driven WNT1 or vector plasmid. The cells were incubated with 10 μm BMVC or BMVC4 for 4 days and then examined by immunoblotting analysis using antibodies against Wnt1, β-catenin, or GAPDH. D, WNT1 overexpression reversed the migration inhibitory activity of BMVC and BMVC4. The relative migration rates were determined in 10 μm BMVC- or BMVC4-treated cells that overexpressing WNT1. The relative migration rate in DMSO-treated H1299 cells was defined as 1. Asterisks indicate p < 0.05 (p = 6 × 10⁻³ for BMVC and 1 × 10⁻⁴ for BMVC4 in the vector control group, respectively).

