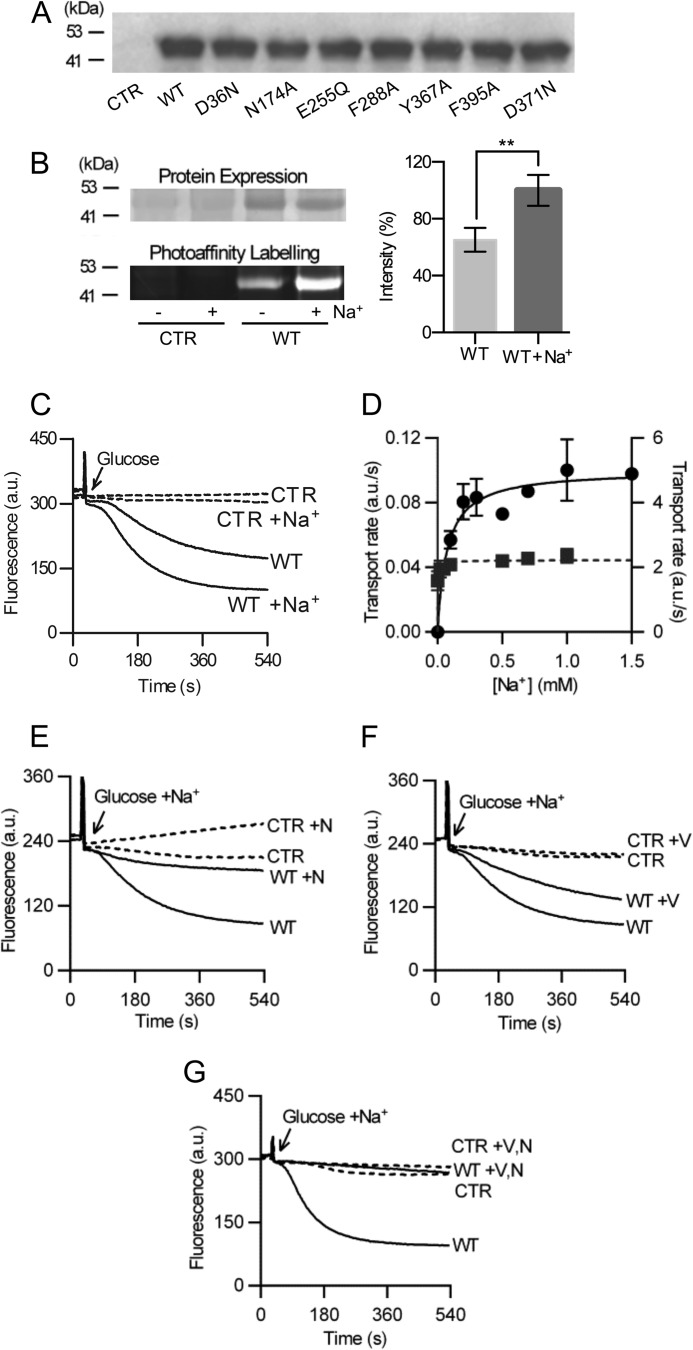
FIGURE 1.
Ethidium binding and transport by NorM-VC in lactococcal membranes. A, Western analysis of total membrane protein in membrane vesicles (5 μg/lane) using anti-His5 antibody shows that wild type (WT) and mutant proteins are expressed at similar levels in the cytoplasmic membrane of L. lactis. B, EMA photolabeling of NorM-VC in the presence or absence of Na+. Lactococcal membrane vesicles (25 mg) containing NorM-VC (WT) or lacking NorM protein (CTR) were incubated with 10 μm EMA in 50 mm Tris-Cl buffer (pH 7.4) containing 10 mm Na2SO4 or K2SO4, and 5 mm MgSO4 at 37 °C for 15 min. Membrane vesicles were exposed to UV irradiation and solubilized total membrane proteins (10 μg) were loaded on a 12% SDS-PAGE gel. Coomassie staining (left panel, top) confirmed equal loading NorM-VC (WT) and lack of the protein in control lanes (CTR). Band intensity of ethidium fluorescence emission of NorM-VC signal (left panel, bottom) was quantified using ImageJ (right panel). **, p < 0.05, significantly different. C, ATP-depleted cells were preloaded with 2 μm ethidium until a saturation level was reached. Active ethidium efflux was initiated by addition of 25 mm glucose as a source of metabolic energy, and 1 mm Na2SO4 (or K2SO4 in control experiments) at the arrow. D, rate of active ethidium efflux (■) (right y axis) as a function of the Na+ concentration in the buffer. For measurements of facilitated ethidium efflux (●) (left y axis), ATP-depleted ethidium-loaded cells were diluted 40-fold in buffer after which the efflux rate was determined as a function of the external Na+ concentration in the absence of glucose. The rate of ethidium efflux in control cells lacking NorM-VC protein was subtracted from the rate observed in NorM-VC expressing cells. E–G, ionophores nigericin (N) or valinomycin (V) or both (0.5 μm each) were added to ethidium-loaded cells 3 min prior to the addition of glucose and 1 mm Na+.

