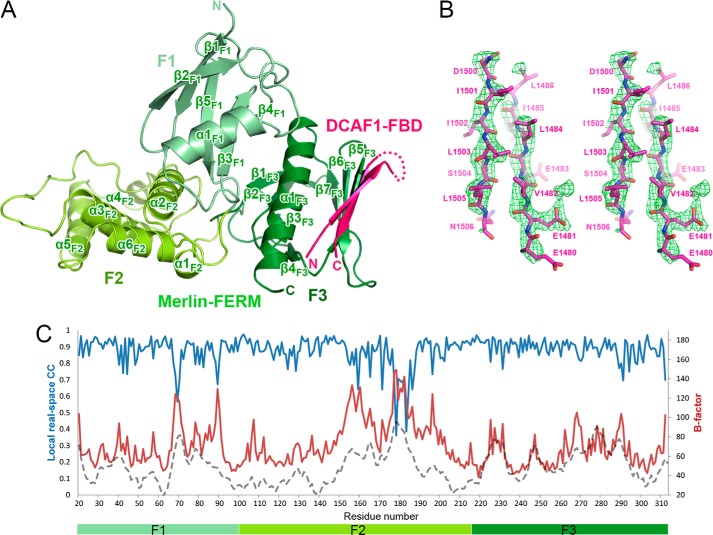
FIGURE 2.
Overall structure of the Merlin-FERM·DCAF1-FBD complex. A, the crystal structure is presented as a ribbon diagram with the three lobes of Merlin-FERM, F1 (light green), F2 (green), F3 (dark green), and DCAF1-FBD (pink) drawn in their specific colors. The same color code is used throughout the rest of the figures except as otherwise indicated. The disordered loop connecting two β-strands is indicated by a dotted line. B, the simulated annealing omit map (green mesh) for the DCAF1-FBD hairpin structure. The map was contoured at 3σ with the structural model superimposed. C, the B-factor (red curve) and real-space (blue curve) correlation plot of Merlin-FERM in our crystal structure. The B-factor distribution (gray dashed curve) of the apo Merlin-FERM structure (Protein Data Bank code 1ISN) was shown for comparison.

