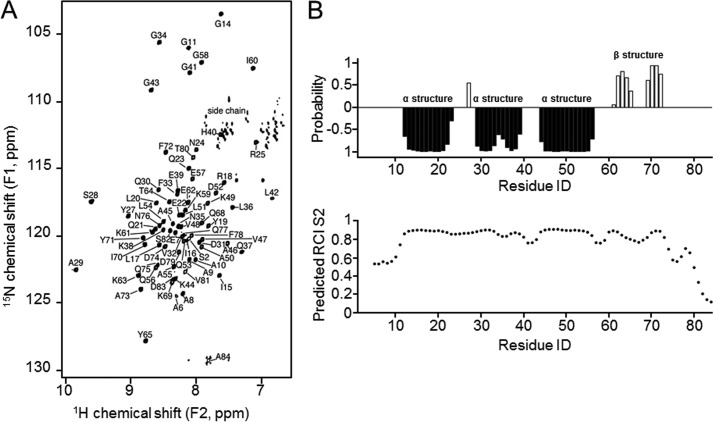
FIGURE 1.
15N-HSQC NMR spectrum and secondary structure analysis of 1–84HOP2. A, peaks corresponding to chemical shifts were assigned with a set of three-dimensional NMR experiments. A typical 15N-HSQC spectrum is shown. B, secondary structures and order parameters predicted using assigned chemical shifts. Negative probabilities indicate propensity for α-helical structures, and positive probabilities indicate β-strands (top panel). Shown is a chemical shift estimation of protein backbone mobility for 1–84HOP2 (lower panel). RCI, random coil index.

