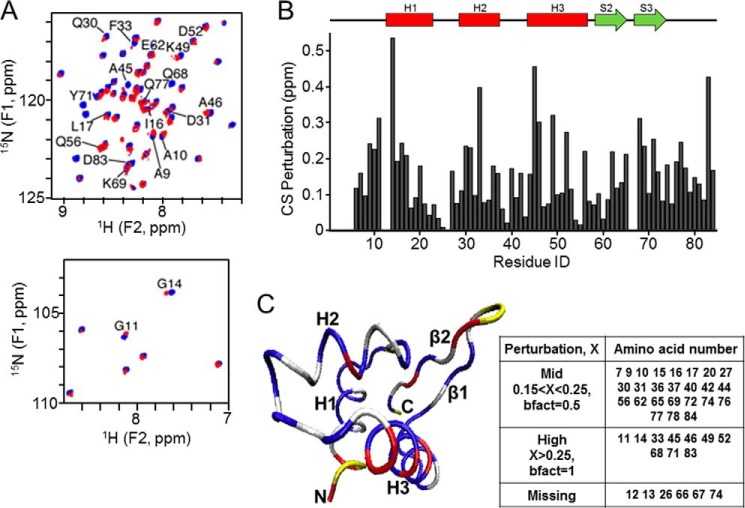
FIGURE 3.
Chemical shift mapping of 1–84HOP2 interacting with DNA. A, DNA titration monitored by 15N-HSQC, showing two regions with significant peak displacements. Blue, initial; red, final. B, graph of the chemical shift variations between the DNA free 1–84HOP2 and the 1–84HOP2-DNA complex plotted against residue number. C, chemical shift perturbation color coded on the structure of 11–74HOP2. Blue, δ < 0.15; gray, 0.15 ≤ δ < 0.25; red, δ > 0.25; yellow, missing due to prolines or unfavorable dynamics. The table contains a list of amino acids involved in the chemical shift perturbation by dsDNA. bfact, B factor.

