
FIGURE 10.
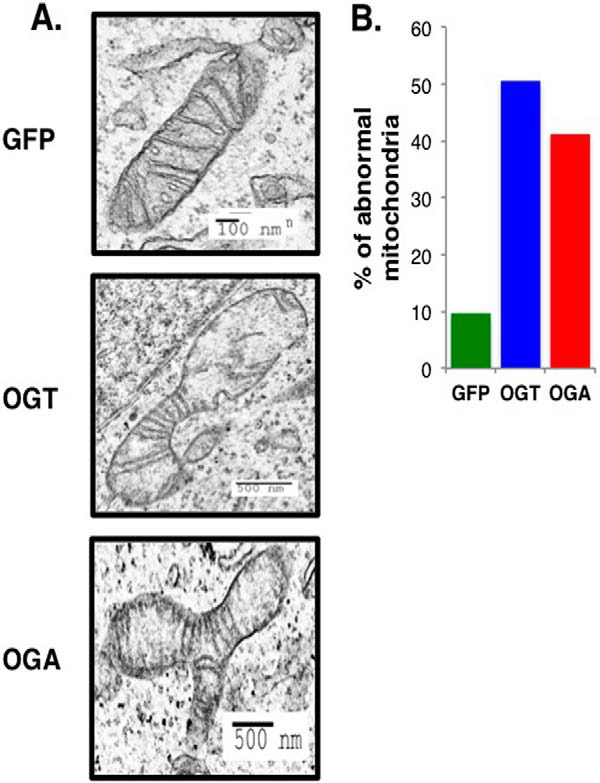
Mitochondrial morphology is disrupted in OGT/OGA-overexpressing cells. A, mitochondria morphology was observed after GFP, OGT, or OGA adenoviral infection by transmission electron microscopy. Scale bars are indicated on each image. B, mitochondria from the overexpressing cells with aberrant morphology and lack of cristae were quantified. The percentage of abnormal mitochondria was calculated and plotted. Counted mitochondria number (n): nGFP = 62, nOGT = 87, nOGA = 85.