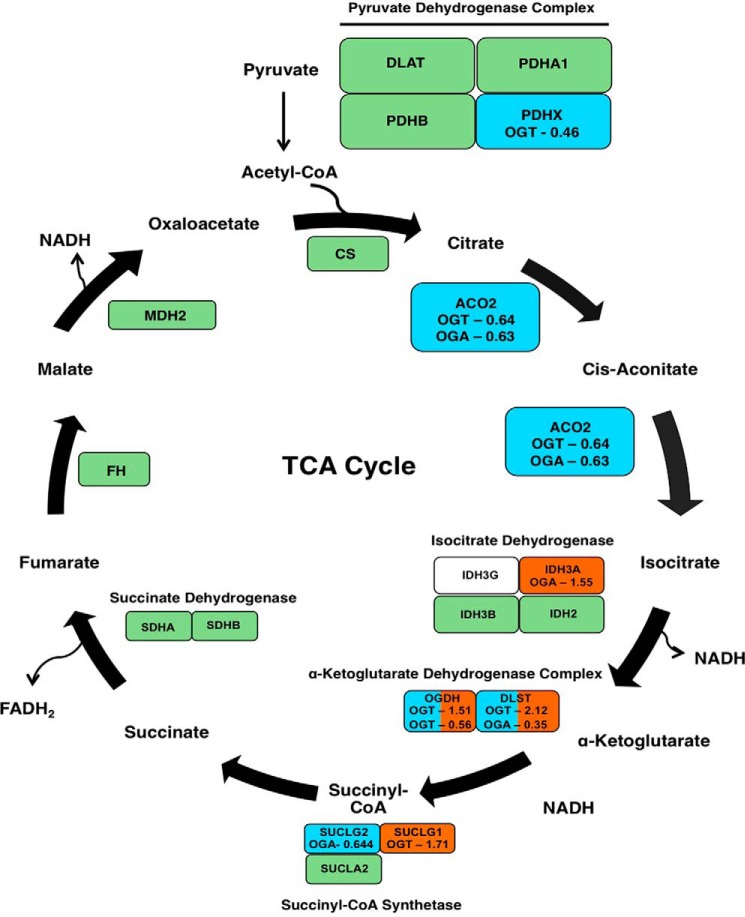
FIGURE 8.
TCA cycle protein expression is altered in OGT/OGA-overexpressing cells. Schematic of the TCA cycle shows enzymes of the cycle in blocks. Teal blocks list proteins whose expression decreased in OGT- or OGA-overexpressing cells. The -fold change induced by either OGT or OGA is listed in the box as well. Green blocks indicate no expression changes whereas proteins in white blocks were not identified.

