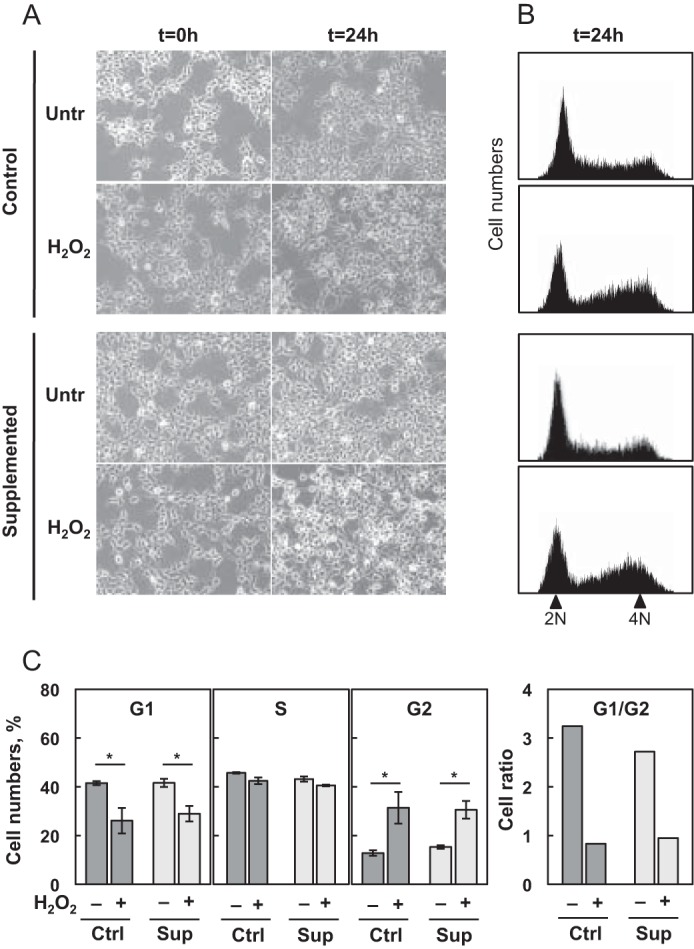
FIGURE 1.

Proliferation of HEK293 cells as a function of selenium levels and H2O2 treatment. HEK293 cells were grown under Ctrl or Sup conditions for 24 h and then submitted to 0 or 300 μm H2O2 treatment (30 min). A, cells were observed in phase-contrast microscopy at time 0 and 24 h post-treatment to compare respective confluency and estimate cell proliferation and phenotype. Untr, untreated. B, cell cycle profiles were determined by propidium iodide staining 24 h post-treatment. 2N represents relative diploid, not replicated equivalent of DNA (G1), 4N represents relative tetraploid, replicated equivalent of DNA (G2/M). C, the relative proportions of cells in G1, S, or G2 phases were obtained by Flowmax and Multicycle software analyses. The results represent the mean ± S.D. of three independent experiments. *, p < 0.05.
