FIGURE 2.

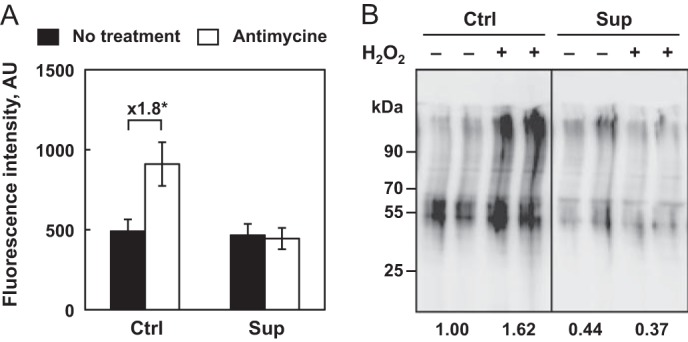
Rate of ROS production and protein damage as a function of selenium levels and oxidative stress. A, rate of mitochondrial ROS production. HEK293 cells were grown under Ctrl or Sup conditions for 24 h and analyzed for MitoSOX Red fluorescence intensity in the absence or presence of antimycine, an inhibitor of mitochondrial complex III. This assay allows rapid quantification of ROS production in the mitochondria of live cells using a flow cytometer. The data represent the mean ± S.D. of three independent experiments. The differences between fluorescence intensities expressed in arbitrary units (AU), that are significant (*, p < 0.05) are indicated above the respective brackets in fold change. B, HEK293 cells were grown and treated as described in Fig. 1. Cell extracts were harvested 24 h post-treatment and evaluated for the presence of protein carbonyl using an Oxiblot commercial kit. The numbers below the gel represent the mean intensity of the duplicate samples relative to the untreated cells under the Ctrl condition, which is set as 1.
