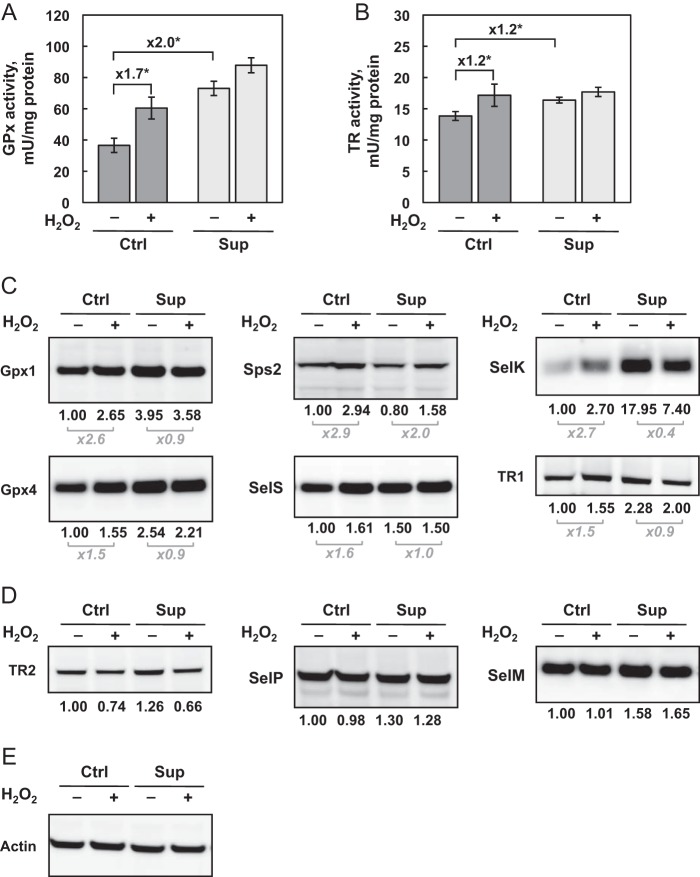
FIGURE 3.
Analysis of selenoprotein levels and enzymatic activities as a function of selenium concentration and H2O2-induced oxidative stress. A and B, HEK293 cells were grown and treated as described in Fig. 1. Cell extracts were evaluated for Gpx (A) and TR (B) activities. The data represent the mean ± S.D. of three independent experiments. The fold changes in activities are indicated above the respective brackets. *, p < 0.05. C and D, selenoprotein expression was investigated in protein extracts by immunoblotting. The results were normalized to the signal for actin (E). The relative expression is indicated with the untreated Ctrl condition set as 1. Selenoproteins are sorted as up-regulated (C) and poorly affected (D) in response to oxidative stress.

