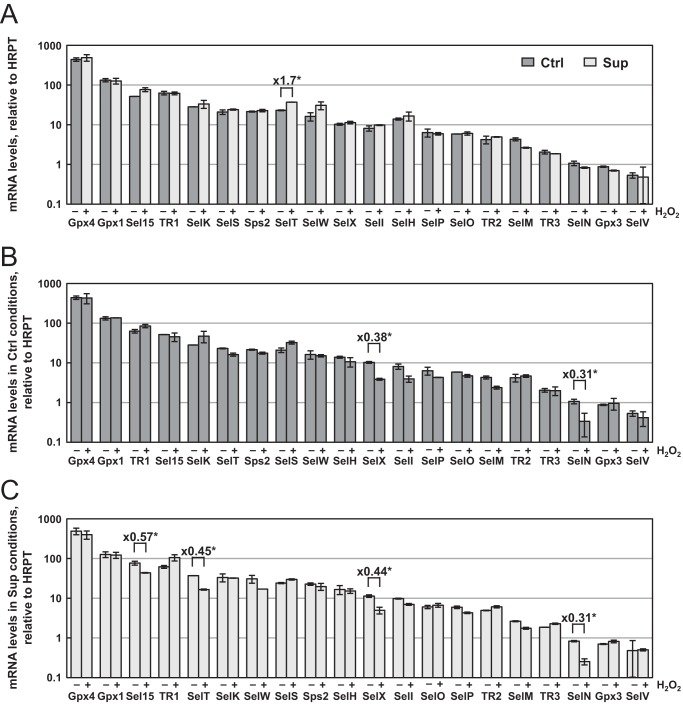
FIGURE 4.
Evolution of selenoprotein mRNA levels as a function of selenium concentration and H2O2-induced oxidative stress. HEK293 cells were grown and treated as described in Fig. 1. The steady-state levels of mRNAs were measured by RT quantitative PCR and normalized to Hrpt mRNA. The data represent the mean ± S.D. of three independent experiments in a logarithmic scale. Differences greater than 50% between levels that are significant (*, p < 0.05) are indicated within the histograms. The influence of selenium is shown in A. The responses to oxidative stress under Ctrl and Sup conditions are represented in B and C, respectively.

