FIGURE 2.
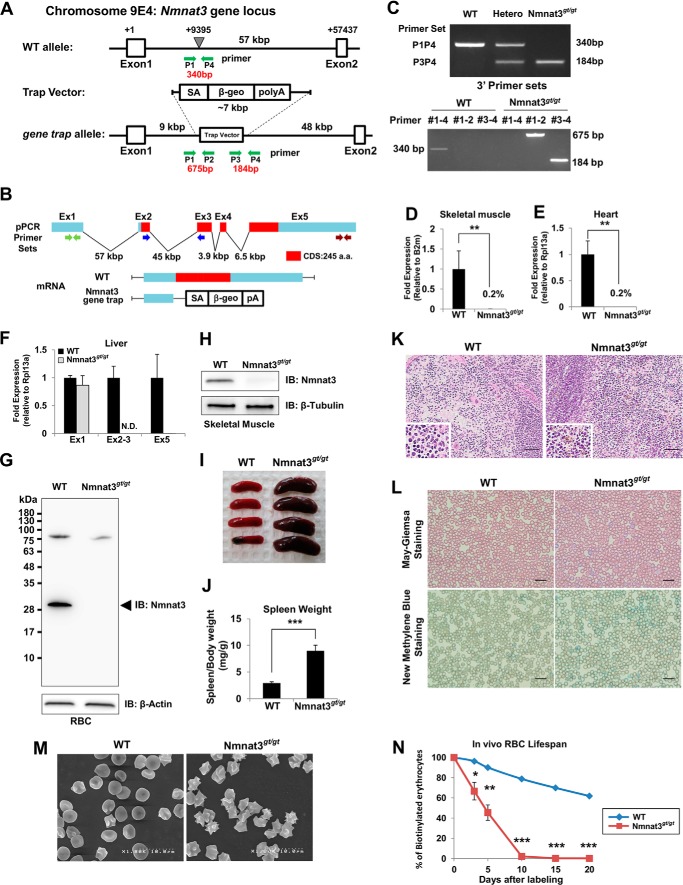
Nmnat3gt/gt mice exhibit splenomegaly and hemolytic anemia. A, map of Nmnat3 gene-trapped allele. The gene-trap cassette was inserted into the indicated point between Nmnat3 gene exon 1 and exon 2. B, structure of Nmnat3 mRNA generated from WT and Nmnat3 gene-trapped allele. The abbreviations used are as follows: SA, splicing acceptor; β-geo, β-galactosidase and neomycin resistance cassette fusion gene; pA, poly(A). C, genotyping PCR of Nmnat3 gene-trap homozygous mice (Nmnat3gt/gt mice). Primer sets are shown as a green arrow in A. These primer sets successfully amplified 340-, 675-, and 184-bp PCR products for wild-type allele, 5′ end and 3′ end of gene-targeted allele, respectively. D–F, real-time quantitative PCR analysis of Nmnat3 mRNA using primer sets to detect exon 1, exon 2–3 junction, or exon 5. Total RNA was prepared from skeletal muscle (D), heart (E), and liver (F). Data are presented as mean ± S.D. (n = 4 for each group). G and H, immunoblot analysis of Nmnat3 in RBC (G) and skeletal muscle (H) prepared from WT and Nmnat3gt/gt mice. β-Actin or β-Tubulin was used as a loading control. Arrowhead indicates the Nmnat3 band (∼30 kDa). I, representative picture of spleens from 8-week-old WT and Nmnat3gt/gt mice. J, ratio of spleen and body weight was calculated using WT and Nmnat3gt/gt mice (n = 4 for each group). K, hematoxylin-eosin (H&E) staining of spleen section prepared from WT and Nmnat3gt/gt mice. Hemosiderin deposit was seen in the enlarged lower left corner. Scale bar represents 50 μm. L, May-Giemsa and New Methylene Blue staining of peripheral blood collected from WT and Nmnat3gt/gt mice. Scale bar represents 20 μm. M, representative scanning electron microscope image of erythrocytes prepared from WT and Nmnat3gt/gt mice. Experiments were independently repeated three times. N, RBCs of 12-week-old mice (n = 3 for each group) were biotinylated by tail vein injection of EZ-Link Sulfo-NHS-biotin and blood was drawn at the indicated time. RBC was labeled with PE-conjugated streptavidin and quantified by flow cytometry. Data are presented as mean ± S.D. (n = 3 for each group). IB, immunoblot.

