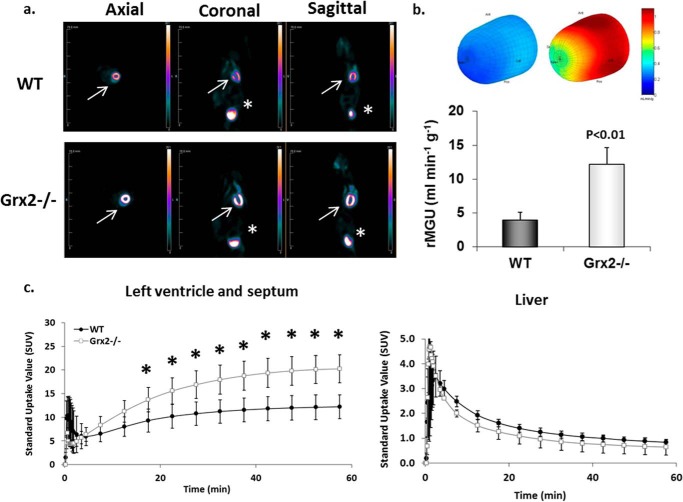
FIGURE 2.
Glucose uptake is increased in the left ventricle of Grx2-eficient mice. a, [18F]FDG images collected from WT and Grx2−/− mice. Static images were collected after 60 min of imaging. White arrow represents location of heart. Asterisk denotes location of bladder. b, three-dimensional polar map of glucose uptake in left ventricle. Maps were generated after 60 min of imaging. The rate of myocardial glucose uptake (rMGU) by the left ventricle was then calculated. n = 4–5, mean ± S.E., Student's t test. c, dynamic measurement of the rate of [18F]FDG uptake by left ventricle and septum. n = 4–5, mean ± S.E., Student's t test. * denotes p < 0.05.

